Logs
Overview
The Logs section in OmegaAI provides a centralized workspace for monitoring, reviewing, and managing all system activities and communication tasks. This includes DICOM, HL7, email, SMS, notifications, faxes, and audit-related events.
Using Logs, you can:
-
Track workflow events in real time
-
Identify issues quickly
-
Troubleshoot communication failures
-
Maintain operational transparency
-
View and manage outgoing DICOM/FHIR tasks (based on permissions)
This manual explains how to access, customize, and interpret each log type in OmegaAI.
Accessing and Monitoring Logs in OmegaAI
This section provides detailed instructions on how to access and monitor different Logs within the OmegaAI system. You will learn how to navigate the Logs interface, utilize various functionalities like searching, sorting, and managing task records, and understand the significance of different columns and statuses associated with tasks.
Steps to Access Logs
-
Open the OmegaAI homepage.
-
In the left-side navigation panel, click the Logs icon to open the Logs page.

-
The DICOM Log appears by default when you open the Logs section.
-
To switch to a different log type, click the blue round DICOM selector button located at the bottom-right corner of the Logs screen.
-
A list of available log types will appear. Select the desired Log type from the list to change the view.
The following logs are available:

Logs Interface Overview
-
Header:
-
Portfolio Name: Displays the name of the currently opened log (e.g., DICOM Log, Email Log, etc.).
-
Record Count (Numeric Indicator): Shows the total number of log records available in the selected log type.
-
Download Icon (Export): Allows you to download the displayed log records in CSV and Excel formats.

-
-
Column Operations:
-
Search and Filter Records: Apply filters based on any column through search filters.
-
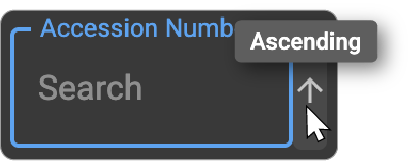
Sorting Records: Sort the records either in ascending or descending order by clicking the drop-down arrow associated with any column and selecting the desired sorting option.
-
Customize Logs
1. Accessing Log Settings
-
Open the DICOM Log page by clicking the Logs icon in the left-side navigation panel on the OmegaAI homepage.
-
Click the blue log selector button at the bottom right corner of the screen.
-
From the list of available log types, choose the log you want to customize---such as DICOM Log, Audit Log, Activity History, or Fax Log.
-
After selecting the log type, click Settings to open the corresponding Log Settings drawer.

2. Customizing Columns
-
Adding Columns:
-
Click the Add (+) icon to insert an empty column into the DICOM Log grid.
-
Select the dropdown arrow on the new empty column and choose the required column name from the list. This lets you add additional data fields that are important for your workflow.
-
-
Clearing Column Values:
- To remove specific data from a column while keeping the column visible, click on the Clear text (X) icon associated with that column.
-
Deleting Columns:
- If a column is no longer needed, click the Delete (Trash) icon associated with the column to remove it from the grid entirely.
-
Rearranging Columns
To change the order of columns in the log layout:
-
Hover over the column name---a drag handle will appear to the left of the column.
-
Right-click the drag handle and drag the column to your desired position.
This lets you easily customize the column order based on your viewing preferences.

-
3. Applying Filters
-
Click on the Filters tab to switch to the Filters section and view all available filter options for the selected log.
-
Use the search fields or dropdowns under each filter category to refine the displayed log records.
-
Apply one or multiple filters simultaneously to narrow down results based on your requirements.
-
After selecting the filters, click Save to apply them to the log view.

4. Applying Sorting Options
-
Click the Sort tab to switch to the sorting section.
-
Click the Add (+) icon to insert a new sort rule.
-
Open the Column Name dropdown and select the field you want to sort by:
-
Use the up/down arrow icons to choose the sort order:
a. Up arrow (↑) for ascending order
b. Down arrow (↓) for descending order
-
If needed, click the Clear (X) icon to reset the selected column.
-
To remove a sort rule, click the Delete (Trash) icon.
-
Click Save to apply the sorting preferences to the log view.

Types of Logs
DICOM Logs
The DICOM Log provides a centralized view for monitoring, tracking, and managing all incoming and outgoing DICOM tasks.
See how to Navigate to DICOM Logs
-
Menu Tab Features
-
Action: Indicates whether DICOM is active and includes Retry/Cancel buttons for DCIOM being sent (not applicable to received studies).
-
Retry: Click to retry a failed transmission, changing the DICOM status back to 'In Progress'.
-
Cancel: Click to cancel a transmission, changing the DICOM status to 'Cancelled'.
-
-
Status: Displays the current status of the task with options to filter records by multiple status fields.
-
Priority and Other Columns: Additional columns such as Priority, Number of Objects, Task Start, Task End, and Duration provide detailed information about the DICOM specifics.
-
Patient and Study Details: Columns like Patient ID, Patient Name, Managing Organization, and others offer details about the patient and study associated with the respective DICOM.
-
-
Monitoring DICOM Details
- View detailed information for each DICOM, including the start and end times, duration, involved parties (like the patient and managing organization), and the purpose of the task (study reason).
See how to Customize DICOM Log Settings
Checking the DICOM Log
- You can check or monitor the DICOM Log by looking at the values in the DICOM Log grid. The following table lists the different columns and their descriptions.
| Column | Description |
|---|---|
| # of Objects | Number of objects sent and received. |
| # Failed | The total number of failed attempts for the task. |
| Accession Number | Accession number of the study that is associated with the order. |
| Action | Indicates whether DICOM is active and includes Retry/Cancel buttons for DCIOM being sent (not applicable to received studies). |
| AE Title | Application Entity Title of the connected device. |
| Creation Date Time | The date and time when the task were created. |
| Delivery Time | The date and time when the system attempted to deliver the DICOM object. |
| Device | The device shows the name of the system, service, or connector involved in processing the DICOM task. This may include PACS gateways, cloud functions, integration services, or local network devices that handle sending or receiving DICOM files. |
| Device Type | Type of system or endpoint involved in the DICOM transaction. |
| DICOM Station | DICOM Station displays the name or identifier of the DICOM workstation, gateway, or service that processed the task. It identifies the specific station or endpoint responsible for sending, receiving, or handling the DICOM transaction. |
| Duration | Total duration from when the task started until its completion time. |
| Execution Time | Date and time at which the task started executing.[SD2.1] |
| Failure Reason | Reason for any failure encountered during transmission. |
| Intent | Shows how actionable the task is. For example, if the task is planned, proposed, etc. |
| Issuer | Displays the Issuer associated with the patient. |
| Last Modified | The time when the record was modified, such as paused, put on hold, or cancelled. |
| Message | Additional message or system note associated with the task. |
| Note | The description of the event and errors, if any. |
| Notification Type | Type of DICOM-related event that triggered a system notification, such as Import, DicomReceive, or DicomStorePush. |
| Managing Organization | Displays the Managing Organization of the record. |
| Patient ID | Unique identifier of the patient involved in the study. |
| Patient Name | Name of the patient related to the DICOM task. |
| Peer Host | Displays the hostname or IP address of the remote system involved in DICOM communication. |
| Reason Code | Reason Code provides a standardized system-generated code that explains the outcome of a DICOM task |
| Receiver | Recipient of the DICOM transmission. |
| Requester | Name of the device requesting the study. |
| Sender | Source system or device sending the DICOM data. |
| Status | • By default, it displays all the statuses of the studies that are sent or received. |
| Status Reason | Provides more information on the current status of the task. Note: For received objects, the reason is always DICOM Receive. |
| Study Date Time | Date and time of study. |
| Study Instance UID | Unique DICOM identifier assigned to an imaging study. |
| Study Description | Provides the DICOM-defined text that describes the imaging exam performed. |
| Task Start | • This field is a date range picker. You can use this to filter studies based on a certain start date. |
| Task End | • This field is a date range picker. You can use this to filter studies based on a certain end date. |
| Transmission Priority | Indicates the urgency level assigned to a DICOM task—such as Low, Medium, High, or Highest.
|
| Trigger | Event or action that initiated the task. |
| Visit # | Visit number linked to the patient or study. |
HL7 Log
The HL7 Log allows you to track all HL7 message transactions within OmegaAI, displaying key details such as status, status reason, intent, description, Study Instance UID, patient information, and requester details to help you monitor and troubleshoot all HL7 communication processes between connected systems.
See how to Navigate to HL7 Log earlier in this guide.
Monitoring HL7 Details
- View detailed information for each HL7 initiative in respective columns: Status, Status Reason, Intent, Description, Study Instance UID, Patient Name, Requester, etc.
Checking the HL7 Log
- You can check or monitor the HL7 Log by looking at the values in the HL7 Log grid. The following table lists the different columns and their descriptions.
| Column | Description |
|---|---|
| Status | Shows the current state of the HL7 message, such as Completed, In Progress, Failed, or Cancelled. |
| Status Reason | Provides additional information explaining why the HL7 message reached its current status. |
| Intent | Shows how actionable the task is. For example, if the task is planned, proposed, etc. |
| Description | A brief statement summarizing the action or update associated with the HL7 message. |
| Study Instance UID | The unique DICOM identifier linking the HL7 message to a specific imaging study. |
| Patient Name | Displays the name of the patient associated with the HL7 message. |
| Requester | Name of the device or system that initiated the HL7 message or requested the study. |
Email Log
The Email Log displays all email activities within OmegaAI, allowing you to monitor each message's status, sender, receiver, trigger, and content for better tracking and troubleshooting of email communications.
See how to Navigate to Email Log earlier in this guide.
Monitoring Email Log Details
- View detailed information for each Email initiative in respective columns: Status, Sender, Receiver, Trigger, Message, etc.
SMS Log
The SMS Log allows you to track all SMS notifications sent through OmegaAI, displaying important details such as status, sender, receiver, trigger, and message content to help you monitor and troubleshoot SMS communication activities.
See how to Navigate to SMS Log earlier in this guide.
Monitoring SMS Log Details
- View detailed information for each SMS initiative in respective columns: Status, Sender, Receiver, Trigger, Message, etc.
Notification Log
The Notification Log provides a detailed record of all system-generated notifications in OmegaAI, allowing you to track each notification's status, sender, receiver, trigger, and message content for effective monitoring and troubleshooting.
See how to Navigate to Notification Logs earlier in this guide.
Monitoring Notification Log Details
- View detailed information for each Notification initiative in respective columns: Status, Sender, Receiver, Trigger, Message, etc.
Checking the Communication Logs
- You can check or monitor the Email, SMS and Notification Log by looking at the values in the grid. The following table lists the different columns and their descriptions.
| Column | Description |
|---|---|
| Status | Indicates the current state of the message, such as Completed, Failed, In Progress, or Cancelled. |
| Sender | Shows the email address, phone number, or system that initiated the message. |
| Receiver | Displays the recipient’s email address, phone number, or user account. |
| Trigger | Identifies the event or action that caused the message to be sent, for example, an appointment confirmation, workflow automation, or order update. |
| Message | Contains the content or body of the notification, email, or SMS sent to the recipient. |
| Execution Time | The exact date and time when the system initiated the message-sending process. |
| Delivery Time | The date and time when the message were delivered or attempted to be delivered, regardless of the outcome. |
| Failure Reason | Displays details explaining why a message failed, if applicable (e.g., invalid address, network error, missing template). |
| Notification Type | Identifies the category or source of the notification sent by the system, such as OAINotification or BlumeNotification. It helps to distinguish which system module or workflow generated the notification. |
Audit Log
This section provides a detailed record of all system-level activities performed by users, services, and internal processes. It helps you monitor access, track changes, and review events for security, compliance, and operational oversight.
See how to Navigate to Audit Log and Customize Audit Log Settings earlier in this guide.
Searching Patient-Related Audit Events
When reviewing audit activity related to a patient, use the following identifiers:
- Patient ID
- Patient Name
These identifiers are commonly logged for actions such as patient record creation, updates, access, or viewing patient-related data.
Searching Study-Related Audit Events
For audit events associated with imaging studies, search using:
- Accession #
- Study Instance UID
- Study Status
- Patient ID or Patient Name
Study-related audit entries typically include events such as study access, viewing, printing, export, or status changes.
Searching Order-Related Audit Events
When tracking activity related to orders, use:
- Accession #
- Visit #
- Patient ID
- Managing Organization
Order-related audit logs capture events such as order creation, modification, execution, or cancellation.
Searching Document-Related Audit Events
For documents (reports, attachments, or clinical files), search using:
- Entity Type = Document
- Patient ID or Patient Name
- Associated Accession # or Visit # (if applicable)
- Action or Subtype (e.g., Create, Read/View, Update)
These events record actions such as document upload, download, modification, or deletion.
Activity History
This section provides a personal record of all actions performed by the currently logged-in user. It helps you track your own changes, updates, and interactions within the system for better transparency and workflow monitoring.
See how to Navigate to Activity History and Customize Activity Log Settings earlier in this guide.
Checking the Audit Log and Activity History
- You can check or monitor the Audit Log and Activity History by looking at the values in the Log grid. The following table lists the different columns and their descriptions.
| Column | Description |
|---|---|
| Access Datetime | The exact date and time when the event or action occurred. |
| Accession # | The unique identifier assigned to the imaging study involved in the event. |
| Action | Indicates the type of operation performed on the system or patient data. Common actions include: |
| Entity Type | Indicates the type of resource or data entity involved in the logged action. This helps you identify which category of system object the user or process interacted with during the event. |
| Entity Role | Indicates the function or role of the entity in the logged action. This helps you understand how the entity participated in the event. |
| Imaging Organization | Displays the Imaging Organization of the record. |
| IP Address | Shows the network address from which the action was performed. This helps identify the source location or device involved in the event. |
| Login Email | Displays the email address of the user who performed the action. This helps identify which user account initiated the event. |
| Managing Organization | Displays the Managing Organization of the record. |
| Outcome | Indicates the result of the action performed. It shows whether the event was successful or if it resulted in a failure, helping you evaluate the status and integrity of each logged operation. |
| Outcome Description | Provides detailed information about the result of the action. It describes what happened during the event, including success messages, system responses, or error details when an issue occurs. |
| Patient ID | Displays the unique identifier assigned to the patient. This helps track which patient records are associated with each logged event. |
| Patient Name | Displays the name of the patient associated with the logged action. This helps identify which patient record was involved in the event. |
| Purpose of Event | Indicates the reason the action was performed. This helps identify the purpose behind the event, such as system use, patient care activity, or operational workflow. |
| Recorded | The timestamp when the event was logged in the system. |
| Request Query | Displays the full request URL or query parameters sent to the server during the action. This shows the exact data request made by the system or user and helps trace how the event was triggered. |
| Study Status | Indicates the current state of the imaging study at the time of the event. This shows where the study is in the clinical or workflow process. |
| Subtype | Specifies the detailed category of the action performed, indicating whether the event involved reading, creating, or updating a resource. |
| Type | Indicates the general category of the action performed. This shows the overall operation type, such as system-level or API-based interactions. |
| Username | The username of the person who performed the action. |
| Visit # | Displays the unique identifier for the patient’s visit or encounter related to the logged action. |
Fax Log
The Fax Log provides a complete record of all incoming and outgoing faxes sent through OmegaAI, displaying details such as fax status, date and time, direction, sender, recipient, pages, duration, and patient or study information. It helps you monitor fax activity, verify successful transmissions, and troubleshoot failed attempts.
See how to Navigate to Fax Logs and Customize Fax Log Settings earlier in this guide.
Checking the Fax Log
- You can check or monitor the Fax Log by looking at the values in the Fax Log grid. The following table lists the different columns and their descriptions.
| Column | Description |
|---|---|
| Accession Number | Shows the accession number associated with the study linked to the fax. |
| Direction | Indicates whether the fax is inbound (received) or outbound (sent). |
| Duration | Total time taken to send or receive the fax. |
| Failed Reason | Indicates the specific cause of a fax transmission failure. This helps identify why the fax did not go through and assists in troubleshooting issues related to connectivity, telephony, or recipient availability. |
| Fax Date/Time | Shows the exact date and time the fax was processed. |
| From | Indicates the sender’s fax number or source. |
| Managing Organization | Displays the Managing Organization of the record. |
| Pages | Displays the total number of pages included in the fax. |
| Patient | Shows the name of the patient associated with the faxed study. |
| Patient ID | Displays the unique patient identifier linked to the fax event. |
| Status | Indicates the current state of the fax transmission or workflow. This helps you understand whether the fax is completed, in progress, failed, or linked to a specific action within the system. |
| To | Indicates the recipient’s fax number or destination. |
| Study | Displays the name of the imaging study associated with the fax. This helps identify which procedure or exam the faxed information relates to. |