Create a Report
A Custom report turns your OmegaAI data into charts, cards, and tables that answer your questions. You build it yourself with a drag-and-drop visual builder, so you don't need any coding.
This article shows you how to start a report, organize it into pages, add and build visuals, and arrange them on the page.
Before you begin
-
Root access: Your role must include access to Root. For details, see Get Started with Root Analytics.
-
Permission: Your role must include the Create/Edit Reports permission. If you can't create a report, ask your administrator. See User access control and roles.
-
Know the terms: A report has one or more pages. Each page holds one or more visuals, such as a bar graph or a table. Each visual shows data fields that you choose.
-
Automatic saving: Root saves your changes and additions automatically, so you don't lose your progress.
Note: Root doesn't show a "Saved" message or indicator. Your changes are saved in the background.
Start a new report
-
On the Root homepage, click the blue + button (Create New Report) at the bottom right.
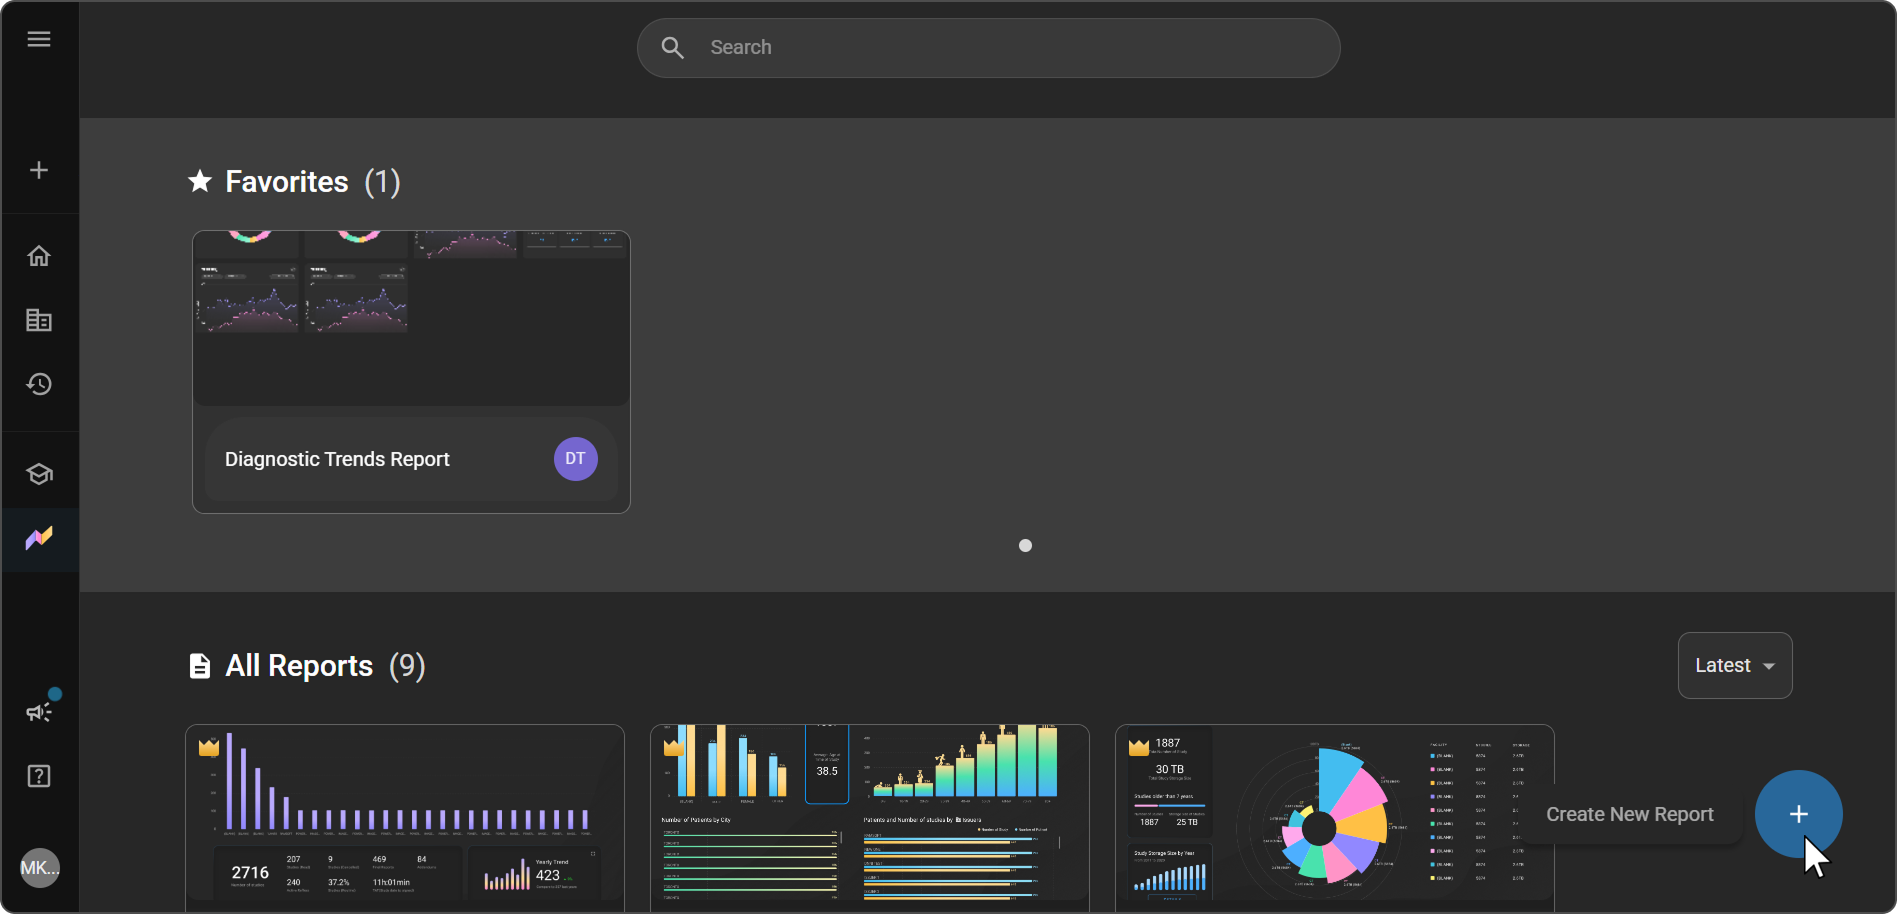
A blank report opens. It's named New Report, and its first page is Page Name 1.
-
At the top left, click New Report, and enter a title for the report. Choose a title that's easy to identify later.
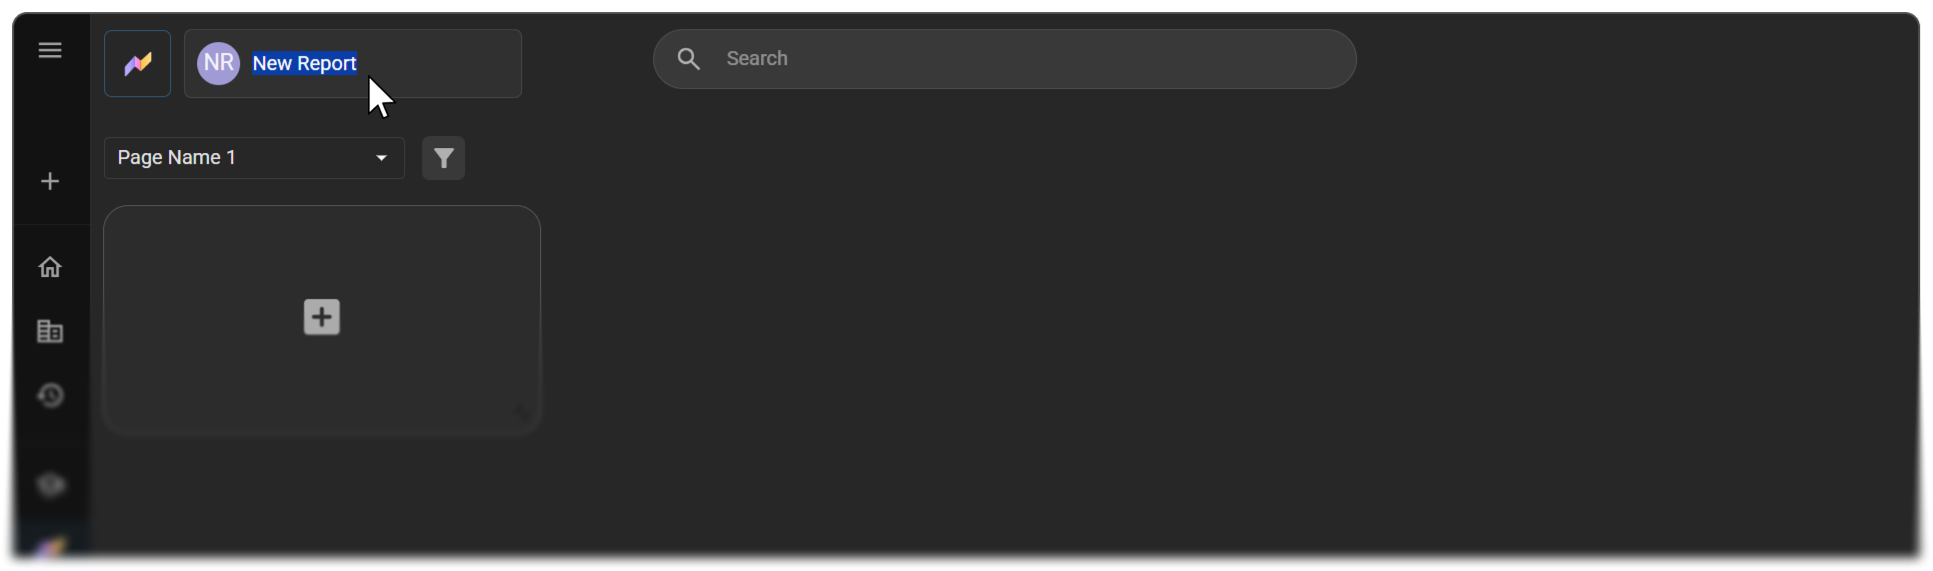
Expected result: The report shows your title at the top left, and the page has one blank tile, ready for your first visual.
Organize your report into pages
Use pages to split a large report into sections. Each page has a fixed size.
Add a page
-
Open the page dropdown at the top left of the report. It shows the current page's name, such as Page Name 1.
-
Click + ADD NEW.
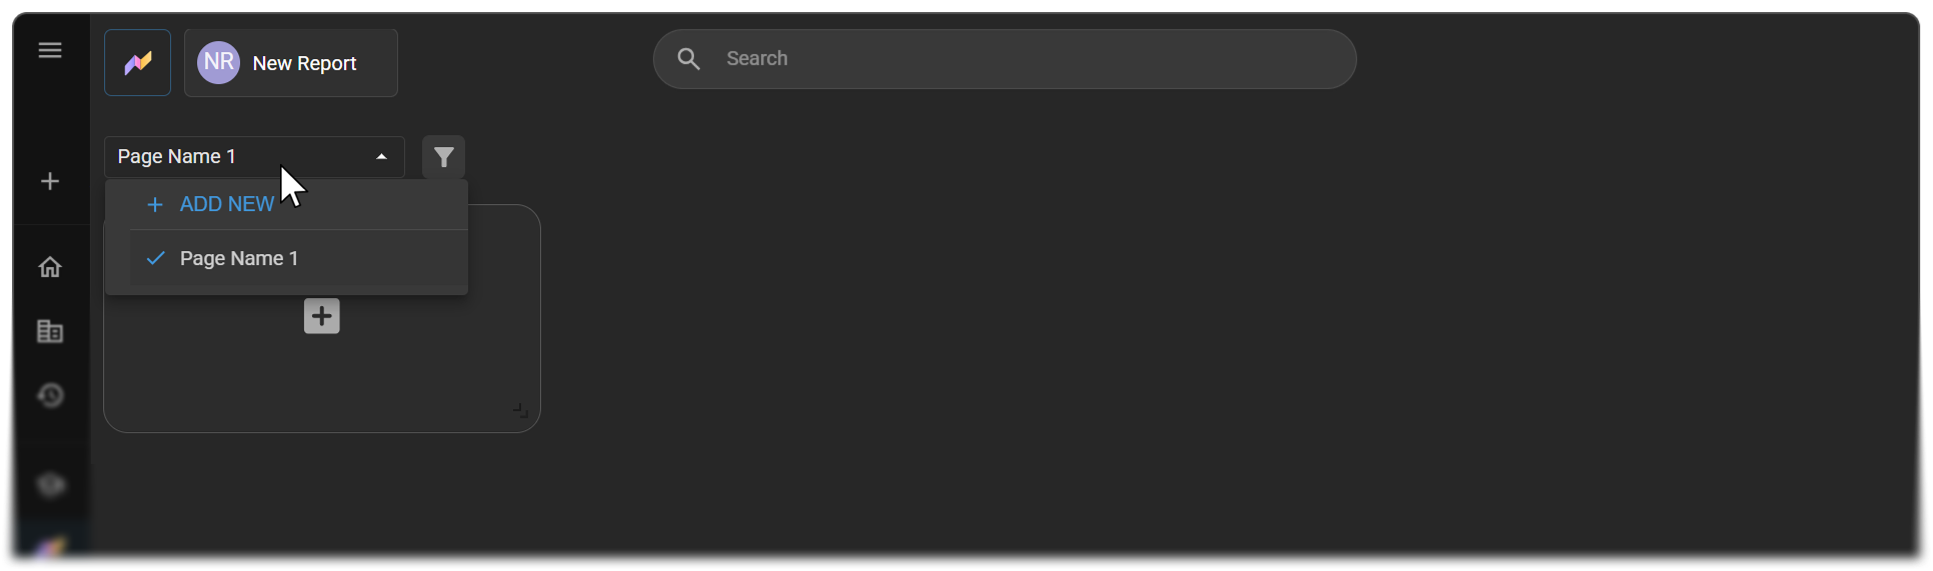
Expected result: A new blank page is added to the report.
Switch pages
- Open the page dropdown.
- Select the page you want. A check mark shows the page you're on.
Rename, duplicate, or delete a page
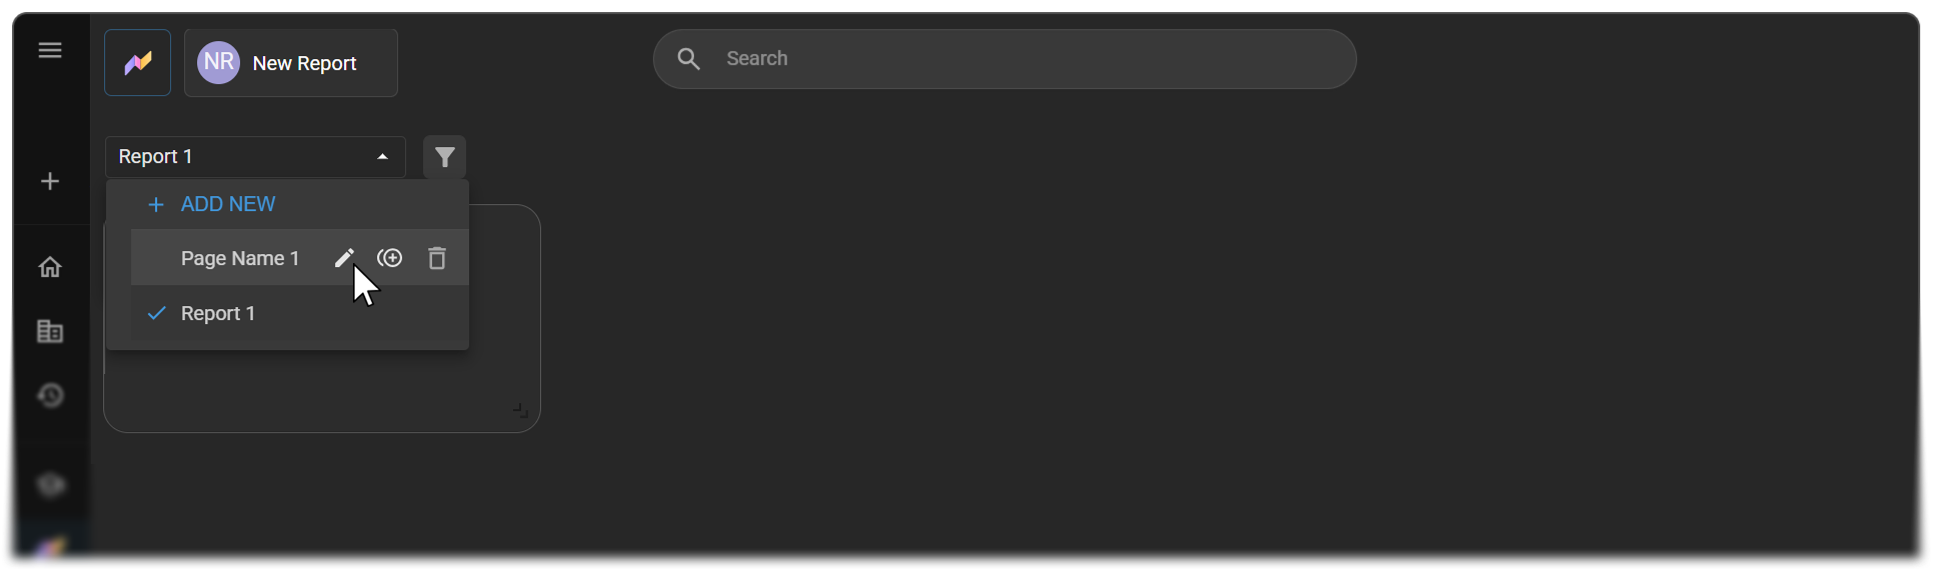
Use the page manager to change your pages:
- Rename a page: Edit the page's name, so it describes its contents.
- Duplicate a page: Create a copy of the page, including its visuals. The copy is named "Page name - Copy" and is added to the end of the page list. Root opens the copy for you.
- Delete a page: Click and hold the delete icon. Root removes the page and opens the page above it. If you delete every page, Root adds a new blank page as page 1.
Choose a visual type
To choose a visual type, hover over the + icon in a blank tile. A palette of five visual types appears. Hover over an icon to see its name, and choose the one that best fits the data you want to show:
|
|

For guidance on which visual to use when, watch the Visual Types walkthrough.
Add and build a visual
-
On a blank tile, hover over the + icon, and click the visual type you want.
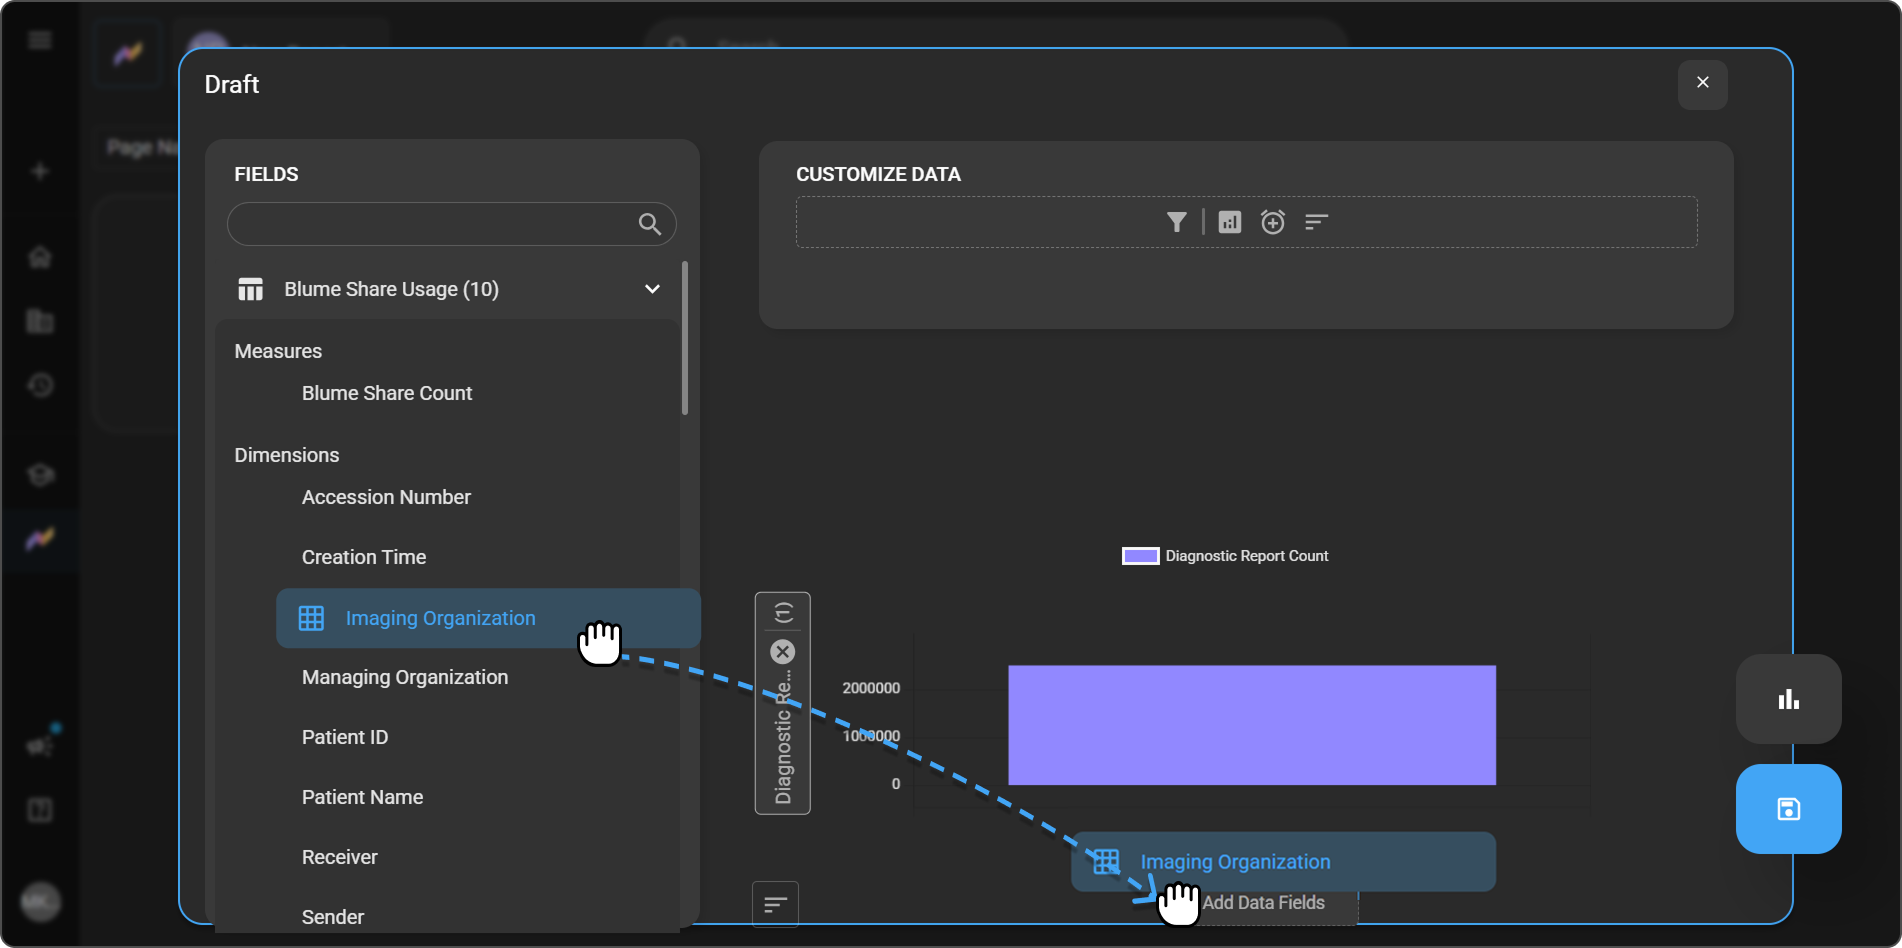
The visual builder opens as a Draft window, with two panels: FIELDS and CUSTOMIZE DATA. Below them, a preview of your visual shows one or more Add Data Fields boxes.
-
In the FIELDS panel, find the field you want. Fields are grouped into categories, such as Date, Order, and Diagnostic Report. The number next to each category shows how many fields it has.
- Browse: Expand a category to see its fields. Each category lists its Measures and Dimensions.
- Search: Type the field name in the search box at the top of the panel.
-
Drag the field onto an Add Data Fields box in the preview.
For a Bar Graph or a Line Chart, drag the measure onto the box on the vertical axis (left), and the dimension onto the box on the horizontal axis (bottom).
-
Repeat steps 2 and 3 until every Add Data Fields box has a field. For example, drag Diagnostic Report Count onto the vertical axis and Imaging Organization Name onto the horizontal axis.
The live preview updates as you add or change fields.
Tip: Measures are values Root counts or calculates, such as Blume Share Count. Dimensions are the categories you break those values down by, such as Imaging Organization. Most visuals need at least one of each.
-
(Optional) To refine the data, use the icons in the CUSTOMIZE DATA panel: Field Filter, Top N Filter, Group by time, and Sort. Hover over an icon to see its name. For details, see Customize a single visual.
-
(Optional) Enter a title for the visual. If you leave it blank, Root creates a title from your fields, such as Blume Share Count by Imaging Organization.
-
To close the visual builder, click X at the top right of the Draft window.
Expected result: The visual appears on the page and shows your data.
Tip: Measures such as average turnaround times (TAT) and RVU totals work well in Visual Cards.
Arrange visuals on the page
-
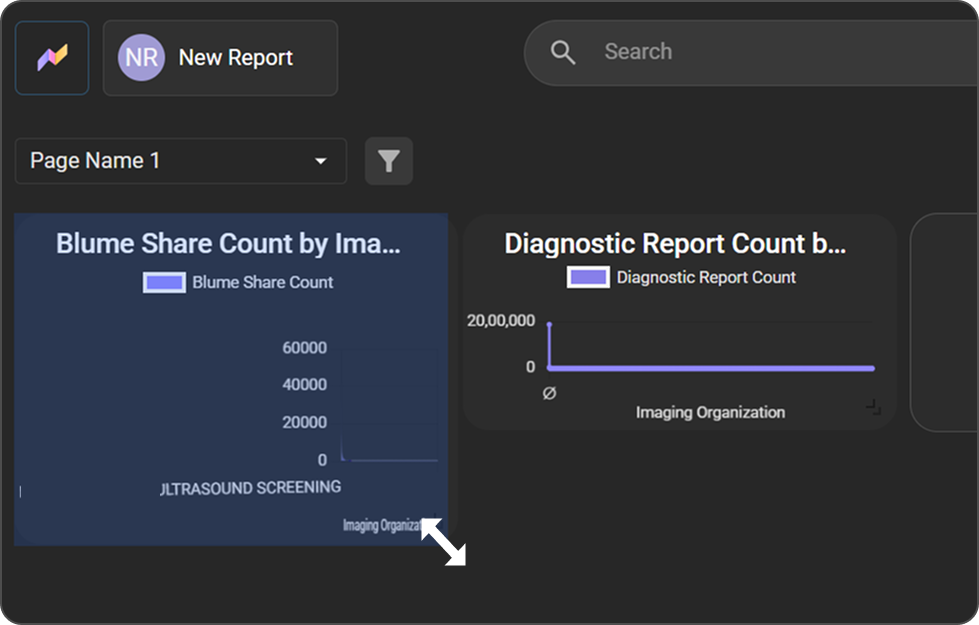
Resize a visual: Drag the handle at the bottom-right corner of the visual to make it larger or smaller.
-
Move a visual: Drag the handle (six dots) next to the visual's title to a new position on the page.
-
Add more visuals: Repeat the steps in Add and build a visual until your report is complete.
Edit, copy, or delete a visual
You can edit, copy, or delete a visual only in Edit mode. You can download it in either mode. When you create a report, it's already in Edit mode. For an existing report, switch to Edit first. See Edit a report.
Hover over a visual, and click one of these icons next to its title:
|
|
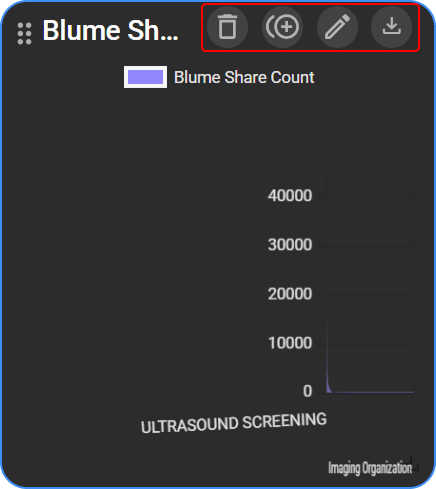
Expected result: A copied or deleted visual appears or disappears on the page right away, and Root saves the change automatically. Edit opens the Draft window, where you change the visual as described in Add and build a visual.
Note: The Delete, Copy, and Edit icons don't appear in View mode. In View mode, hovering over a visual shows Show as table and Download instead. See View a chart as a table.
Finish and leave the report
When you're done, click the Root icon at the top left, next to the report title.
Expected result: The Root homepage opens. Your new report appears under All Reports, and you can open or edit it at any time. To share it, see Share a Report.
Watch the walkthroughs
Visual Builder and Layout
Learn how to build a visual and arrange it on the page.
Visual Types
Learn which visual type to use for your data.
Troubleshooting
- My visual is blank, or shows "No data returned. Please modify configuration and try again.": Make sure every Add Data Fields box has a field. For example, a bar graph needs a measure, such as Diagnostic Report Count, and a dimension, such as Imaging Organization Name. If every box has a field, a filter might be excluding all the data. See Filter and Customize Report Data.
- My chart has too many bars or slices to read: Limit the data with the Top N Filter. See Show only the top entries.
- I can't create a report: Your role doesn't include the Create/Edit Reports permission. Ask your administrator.
- I need turnaround time, RVU, or physician breakdowns: See this troubleshooting entry.
Related articles
- Get Started with Root Analytics: Learn the Root homepage and report types.
- Use Premium Reports: Check whether a ready-made report already covers what you need.
- Filter and Customize Report Data: Filter, limit, group, and sort the data in your visuals.
- Open, Edit, and Organize Your Reports: Edit, copy, export, and delete your reports.
- Share a Report: Share your finished report with your team.
- User access control and roles: Give a role the Create/Edit Reports permission.