Filter and Customize Report Data
A visual is most useful when it shows only the data that matters to you. Root gives you four tools to fine-tune your data: filter it, limit it to the top entries, group it by time, and sort it.
You can apply these tools to a single visual, or to every visual on a page at once. This article explains each tool and when to use it.
Before you begin
-
A report to work on: You need a Custom report with at least one visual. To create one, see Create a Report.
-
Edit access: You can customize only reports you own, or that are shared with you with Can edit access. Premium reports are read-only.
-
Permission: Your role must include the Create/Edit Reports permission. See User access control and roles.
Choose the right tool
| Tool | What it does | Example |
|---|---|---|
| Field Filter | Shows only the data that meets your criteria. You can filter by any data field available in Root. | Show only CT studies by filtering on Modality. |
| Top N Filter | Limits a visual to a set number of rows or data points, so you can focus on the top entries. | Show the top 10 referring physicians. |
| Group by time | Groups your data by a time period and a time interval, so you can track trends over time. | Show this month's study count, grouped by week. |
| Sort | Arranges the data in ascending or descending order of a field. | Sort physicians from the most studies to the fewest. |
Understand visual filters and page filters
- Visual-level filters: Apply to one visual only. You set them in the CUSTOMIZE DATA panel of the visual builder. See Customize a single visual.
- Page-level filters: Apply to every visual on the page. You set them from the Report Filter icon at the top of the page. A page-level filter can be a Field Filter or a Group by time filter. See Filter every visual on a page.
Customize a single visual
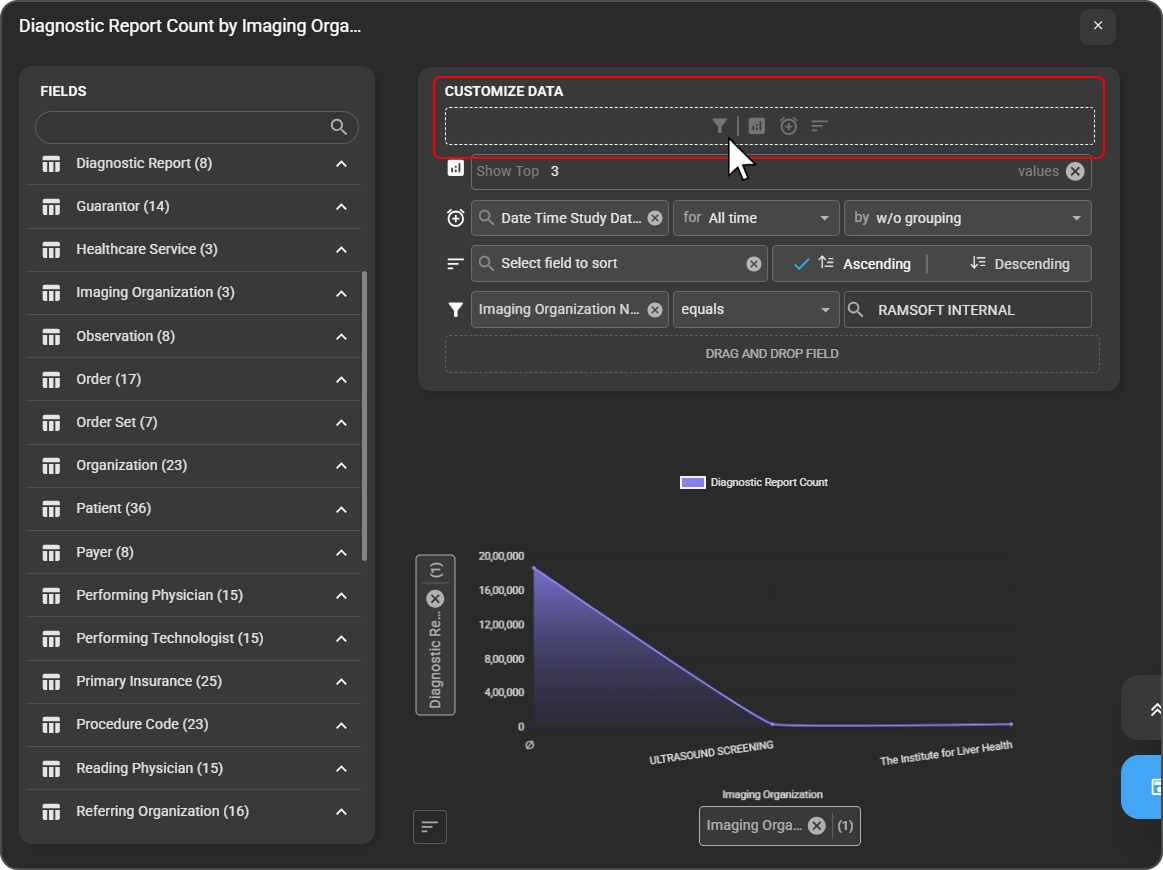
All four tools are icons in the CUSTOMIZE DATA panel of the visual builder (the Draft window). Hover over an icon to see its name. To open the builder, open your report in Edit mode, hover over the visual you want to change, and click the Edit icon (pencil). To switch modes, see Edit a report.
Apply a field filter
-
In the CUSTOMIZE DATA panel, click the Field Filter icon (funnel).
-
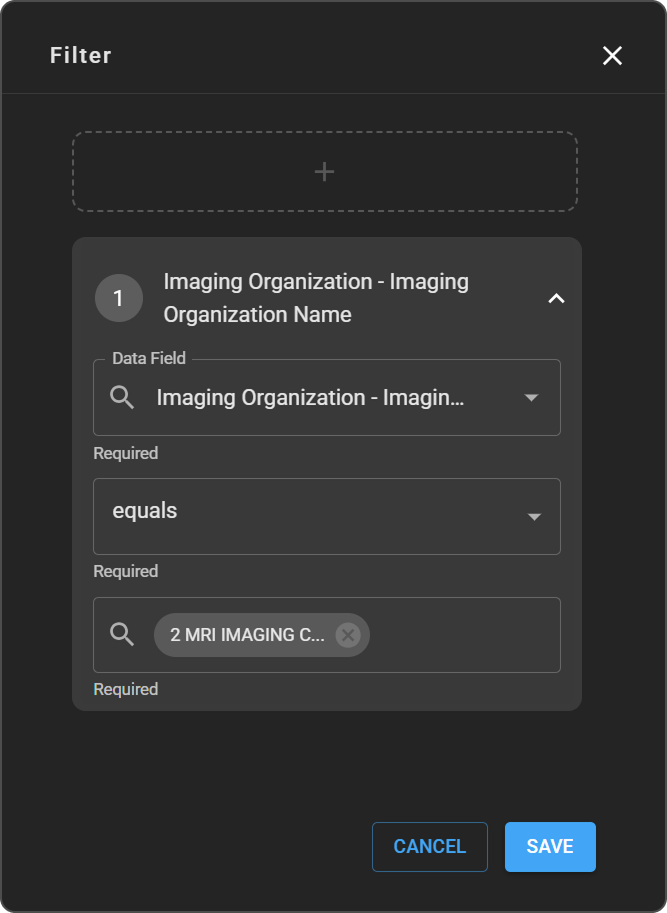
From the FIELDS panel, drag the field you want to filter by into the DRAG AND DROP FIELD box. For example, drag Imaging Organization Name. To find a field, type in the search box, or expand a category to browse its fields.
A filter row appears, with the field, an operator, and a values box.
-
Select an operator:
Operator Includes data where the field… equals Matches one of the values you choose. does not equal Doesn't match any of the values you choose. contain Contains the text you enter. not contain Doesn't contain the text you enter. starts with Starts with the text you enter. ends with Ends with the text you enter. is set Has a value. You don't choose values for this operator. is not set Is empty. You don't choose values for this operator. -
If the operator needs values, click the values box, and search for and select them. Each value you select appears as a tag. To remove a value, click x on its tag.
Expected result: The visual shows only the data that meets your criteria.
Tip: After you close the visual builder, the filter also appears on the visual itself. Click it to change the selected values without reopening the builder.
Show only the top entries
-
In the CUSTOMIZE DATA panel, click the Top N Filter icon (bar chart).
A Show Top row appears.
-
Enter the number of entries to show. It must be a whole number greater than 0. For example, enter
3to show the top 3 imaging organizations.
Expected result: The visual updates to show only the top entries you chose.
Group data by time
-
In the CUSTOMIZE DATA panel, click the Group by time icon (alarm clock).
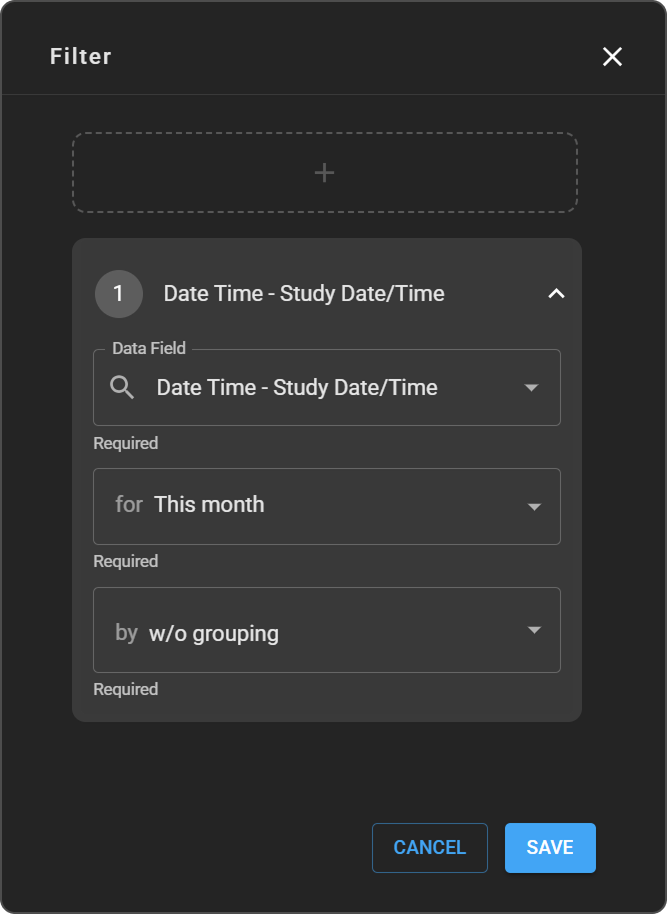
A row appears with a date field box, for, and by.
-
Click the date field box, and select the date field to group by. The fields are listed by category. For example, under Date, select Study Date.
-
In for, select the time period to analyze. See the options in the table after these steps.
-
In by, select the interval to group the data by. The default is w/o grouping, which shows the whole period without splitting it into intervals.
| Setting | Options |
|---|---|
| for (period) | All time, Today, Yesterday, This week, This month, This quarter, This year, Last 7 days, Last 30 days, Last week, Last month, Last quarter, Last year |
| by (interval) | w/o grouping, Second, Minute, Hour, Day, Week, Month, Quarter, Year |
For example, set for to This month and by to Week to see this month's data, week by week.
Expected result: The visual shows your data trends for the period and interval you chose.
The period appears under the visual's title, for example Execution Time: Today.
Sort the data
- In the CUSTOMIZE DATA panel, click the Sort icon (horizontal lines).
- In Select field to sort, select a field. The list shows the fields in your visual, such as Imaging Organization or Diagnostic Report Count.
- Click Ascending or Descending. A check mark shows your choice. The default is Ascending.
Expected result: The data is reorganized in the order you chose. For example, sort Diagnostic Report Count in Descending order to show the busiest organizations first.
Remove a customization
Each tool you use adds a row to the CUSTOMIZE DATA panel. To remove a tool, click x at the end of its row, or on its field.
Filter every visual on a page
-
Open your report in Edit mode, and go to the page you want to filter. To switch modes, see Edit a report. To switch pages, see Switch pages.
-
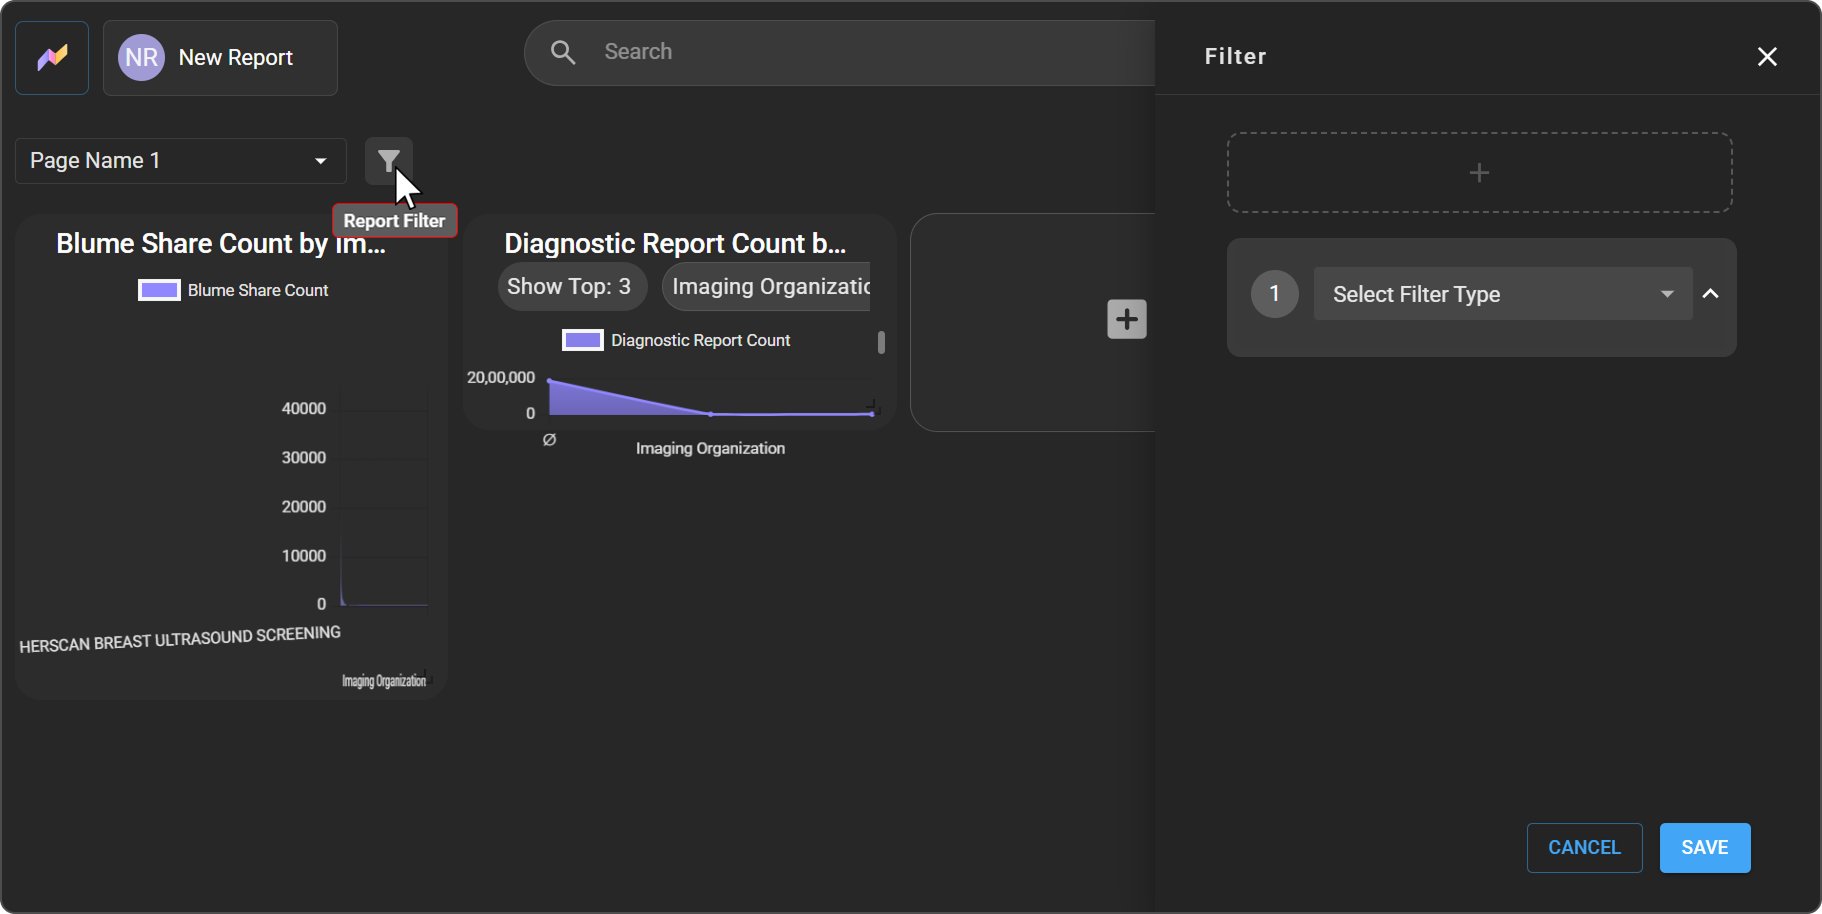
Click the Report Filter icon (funnel), next to the page dropdown.
The Filter drawer opens, with one numbered filter.
-
In Select Filter Type, select Field Filter or Group by time.
-
Set up the filter:
|
|
|
|
- (Optional) To add another filter, click the + box at the top of the drawer. To remove a filter, expand it and click the delete icon (trash bin).
- Click SAVE.
Expected result: The filters appear as labels at the top of the page, next to the page dropdown, and apply to every visual on it. For example, Study Date/Time: This month | week.
Tip: To close the drawer without saving your changes, click CANCEL.
Tip: If a page has more filters than fit across the top, use the > arrow to scroll through them.
Watch the walkthrough
Learn how to apply filters to a visual and to a page.
Troubleshooting
- A visual shows "No data returned. Please modify configuration and try again.": No data meets your filter criteria. Check the visual's filters and the page filters at the top of the page. Widen a filter, or remove a value.
- I can't open the CUSTOMIZE DATA panel: The report might be in View mode, or shared with you with Can view access. See Edit a report.
- A report returns zero rows for a specific date range, but works for "All Time": See this troubleshooting entry.
- Fields show blank, null, or unexpected values: See this troubleshooting entry.
Related articles
- Create a Report: Build the visuals you want to customize.
- Open, Edit, and Organize Your Reports: Switch to Edit mode, and export a filtered page.
- Use Premium Reports: Filter the ready-made reports.
- Get Started with Root Analytics: Learn the Root homepage and report types.