Open, Edit, and Organize Your Reports
As your list of reports grows, Root helps you keep it organized and easy to use. You can sort your reports, mark favorites, open and edit reports, make copies, export your data, and delete reports you no longer need.
This article follows a report's life: finding it on the Root homepage, viewing and exporting it, editing and copying it, and finally deleting it. To share a report, see Share a Report.
Before you begin
-
Root access: Your role must include access to Root. For details, see Get Started with Root Analytics.
-
Permissions: To open Custom reports, your role needs the View Regular Reports permission. To edit reports, it needs the Create/Edit Reports permission. See User access control and roles.
-
Custom reports only: You can edit, copy, or delete only Custom reports. Premium reports are read-only.
What you can do with each report
What you can do depends on the report type and whether you own it:
| Task | Your own Custom report | A Custom report shared with you | A Premium report |
|---|---|---|---|
| Open, view, and favorite | Yes | Yes | Yes |
| Export or download | Yes | Yes | See Use Premium Reports |
| Edit | Yes | Only with Can edit access | No |
| Copy, share, or delete from the card | Yes | No | No |
Organize your report list
Sort your reports
-
On the Root homepage, at the top right of All Reports, click the sort list. By default, it shows Latest.
-
Select Latest, A to Z, or Z to A.
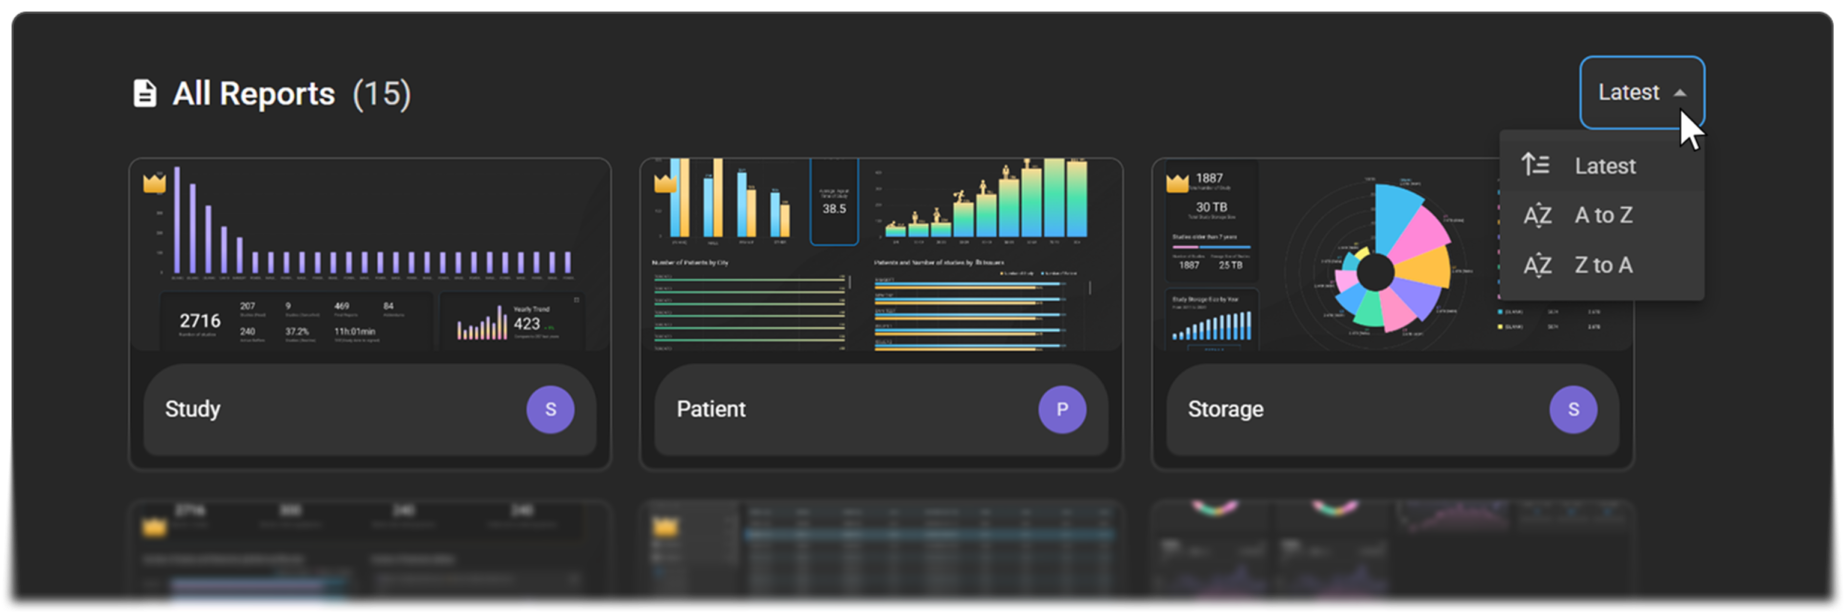
Expected result: The report grid updates immediately.
Mark a report as a favorite
|
|
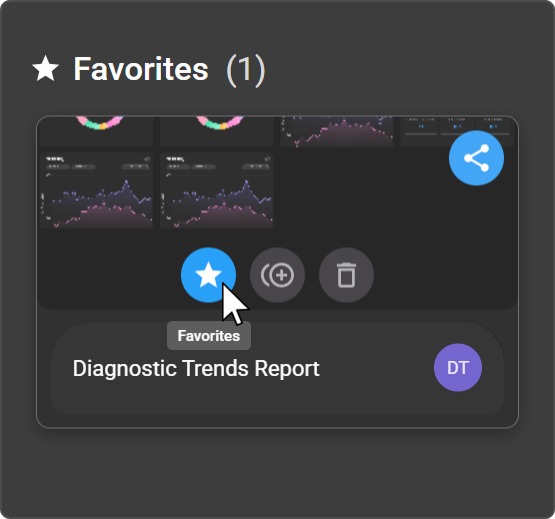
Expected result: The star turns blue, and the report is added to the Favorites section at the top of the homepage, for quick access.
To remove a report from your favorites, click the star icon again. The report is removed from the Favorites section.
Open and view a report
To open a report, click its card on the Root homepage.
Expected result: The report opens in View mode.
Tip: Hover over a chart to see the exact value for each bar, line point, or slice.
Understand View and Edit modes
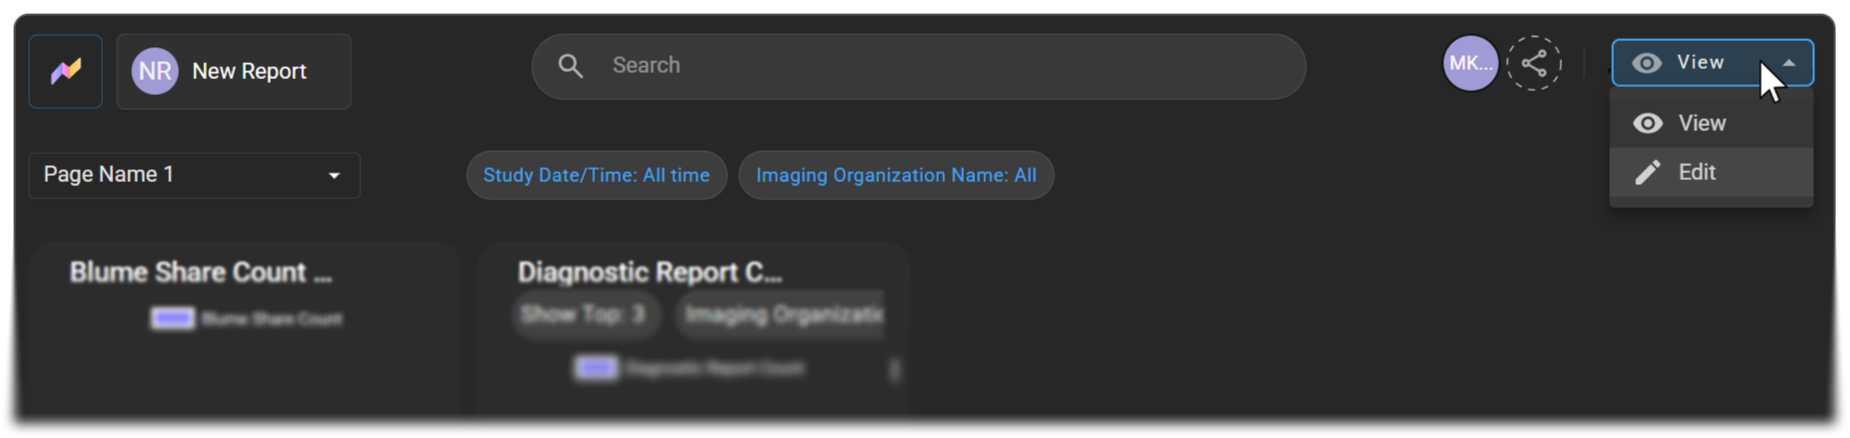
An open report is in one of two modes. The mode list at the top right shows the current mode: View (eye icon) or Edit (pencil icon). When you open an existing report, it opens in View mode. A new report opens in Edit mode, so you can start building it right away.
| Mode | Use it to |
|---|---|
| View | Read the report, show a chart as a table, download a visual, and export a page as a PDF. Page filters appear as labels at the top of the page. |
| Edit | Change the report: add, edit, copy, delete, or download visuals, rename the report or its pages, and add page filters with the Report Filter icon. |
View a chart as a table
In View mode, you can switch a chart to a table to see its exact numbers.
|
|
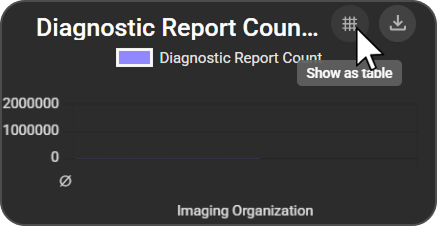
Expected result: The chart's data appears as a table. Your chart settings don't change.
To switch back, hover over the table, and click the Show as visual icon. The icon matches the chart type, such as a pie chart icon.
Download a visual
You can download a single visual as a file, in View or Edit mode.
|
|
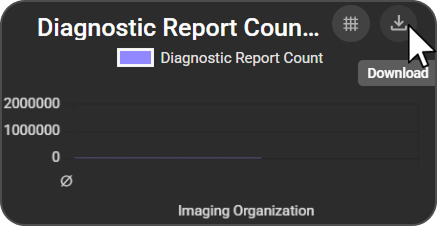
- Select a format:
- CSV: The visual's data, for use in a spreadsheet app.
- JPG or PNG: An image of the visual, as you see it on screen.
Expected result: The file downloads to your computer.
Note: The Download icon appears only when the visual shows data. If a visual shows "No data returned," there's nothing to download. To fix an empty visual, see Filter and Customize Report Data.
Note: A Table View visual can be downloaded only as a CSV file.
To export a whole page instead, see Export a report page as a PDF. To export raw study data, use the Data Export Premium report. See Export your data with the Data Export report.
Export a report page as a PDF
-
Open the report in View mode, and go to the page you want to export.
-
Click the Export to PDF icon (download arrow) at the top right of the page, above the visuals.
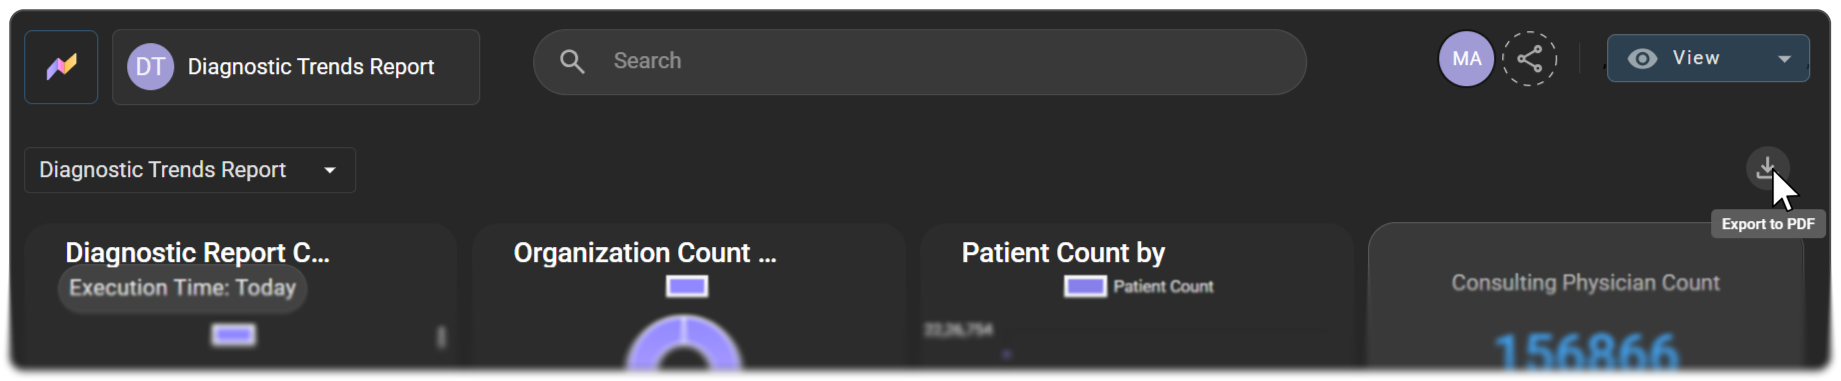
Expected result: Root shows an "Exporting the Report" message, then downloads the current page as a PDF file.
Note: You can't export while you're editing a report. Switch back to View mode first.
Edit a report
You can edit any Custom report you own, or one that's shared with you with Can edit access.
-
Open the report.
-
At the top right, open the mode list, and select Edit.
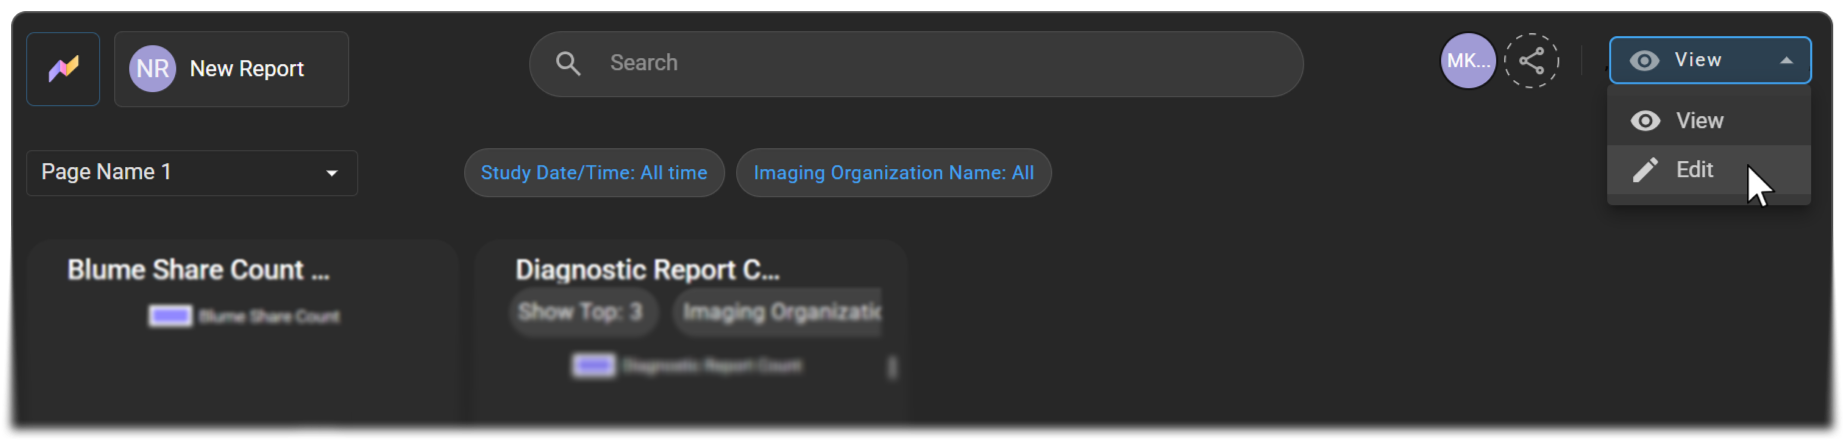
-
Make your changes:
- Change a visual: Hover over the visual, click the Edit icon (pencil), and change its fields in the visual builder.
- Rearrange the page: Resize or move visuals.
- Rename: Change the report title or a page name.
- Remove a visual: Delete visuals you no longer need. Hover over the visual, and click the Delete icon (trash bin).
Expected result: Your changes are saved automatically.
Note: Premium reports (marked with a gold crown icon) are read-only, so you can't edit them.
For full details on pages and visuals, see Create a Report. To change the data a visual shows, see Filter and Customize Report Data. To watch an edit from start to finish, see Watch the walkthrough.
Copy a report
Copy a report when you want a similar report without changing the original.
|
|
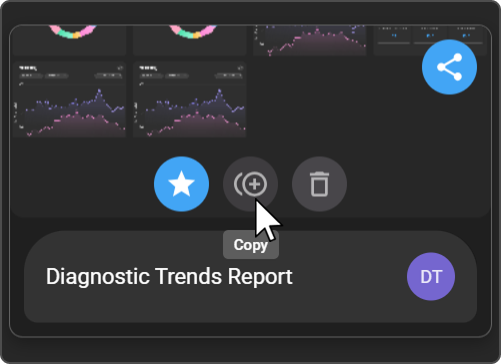
Expected result: The copy opens in Edit mode, named "Report Name - Copy," for example Diagnostic Trends Report - Copy. It's added to your report list, and you can change it without affecting the original.
Note: You can copy only Custom reports you own. Premium report cards and reports someone else has shared with you don't show the copy icon.
Delete a report
|
|
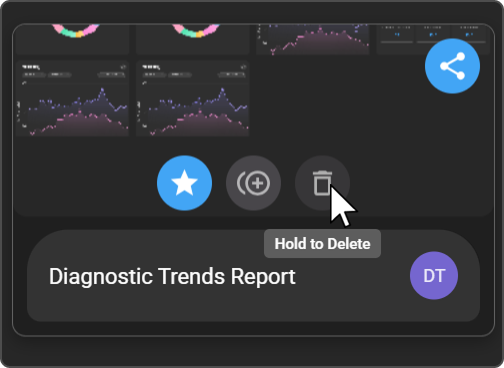
Expected result: The report is removed from your report list.
Important: Deleting a report is permanent and can't be undone. Only the report's owner, or an authorized user, can delete a report. The delete icon doesn't appear on reports someone else has shared with you.
Watch the walkthrough
Learn how to edit an existing report.
Troubleshooting
- I can't edit any reports: Your role doesn't include the Create/Edit Reports permission. Ask your administrator.
- A report card shows only the star icon: Someone else owns the report and shared it with you. You can view it and mark it as a favorite, but only the owner can copy, share, or delete it.
- I can't edit a report: It might be a Premium report, which is read-only. Or the owner might have shared it with you with Can view access. Ask the owner for Can edit access. See Share a Report.
- I don't see the Export to PDF or Show as table icon: Switch the report to View mode. These icons don't appear while you're editing.
- I don't see the Download icon on a visual: The visual has no data to download. Check its filters. See Filter and Customize Report Data.
- The Export to PDF icon stays disabled after an export: Reload the page, and try again.
- The delete icon doesn't do anything: Make sure you click and hold the icon, rather than clicking it once.
Related articles
- Get Started with Root Analytics: Learn the Root homepage and card icons.
- Use Premium Reports: Export raw study data with the Data Export report.
- Create a Report: Add pages and visuals to a report.
- Filter and Customize Report Data: Change the data a visual shows.
- Share a Report: Give others Can view or Can edit access.
- User access control and roles: Give a role the Root permissions it needs.