Additional Tools
Overview
The OmegaAI Image Viewer includes a set of tools designed to support a broad range of clinical and operational workflows — from playing multi-frame sequences and comparing studies side by side, to exporting data, marking key findings, and generating hard copies for documentation. This article covers all available tools in this category, their access methods, and how to use them.
Quick Reference
Click any tool name to jump directly to its detailed description.
| Tool | Description |
|---|---|
| Burn Study | Write the current study to a CD or DVD |
| Cine | Play a multi-frame image series as a continuous loop |
| Copy | Copy the current image with annotations to the clipboard |
| Download | Export an image or full study from the Image Viewer |
| Fusion | View PET and CT images in a combined blended display |
| Key Image | Mark a specific image as clinically significant |
| Link | Synchronize scrolling, zoom, and panning across viewports |
| MPR | View volumetric data across axial, sagittal, and coronal planes |
| Print the currently displayed image with annotations | |
| Tile Mode | Arrange multiple images in a grid layout within a viewport |
| Prior Navigation | Navigate forward and backward through prior study sets |
1. Burn Study
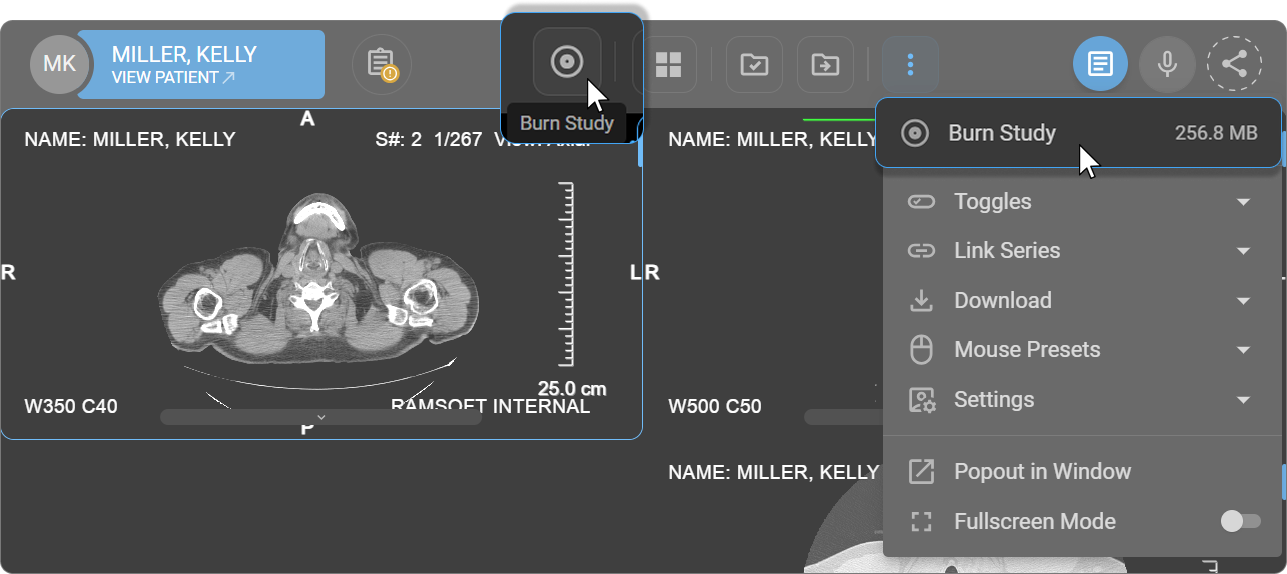
The Burn Study feature writes the current study onto a CD or DVD. It is used for sharing patient imaging data with other facilities, providing patients with their own records, and archiving studies for compliance or backup purposes.
How to Access
- From the toolbar — add via Customize Toolbar, then click Burn Study.
- From the More Options menu — click ⋯ → Burn Study.
How to Use
- Open the study in the Image Viewer.
- Click Burn Study. The study size is displayed, confirming the total data to be written to the disc.
- A small executable file — RamSoft.DiscImageBurner.exe — is downloaded automatically. Run this file to initiate the burning process.
- A command prompt window opens displaying real-time progress, including percentage complete, data transferred, and elapsed time.
- The Windows Disc Image Burner dialog opens. Select the appropriate disc burner from the dropdown and click Burn.
Note: Ensure appropriate permissions and data security practices are followed before transferring patient data to removable media.
The Burn Study feature is also available directly from the Worklist. See Burn Study in the Worklist.
Learn more about how to access DICOM files exported from OmegaAI.
2. Cine
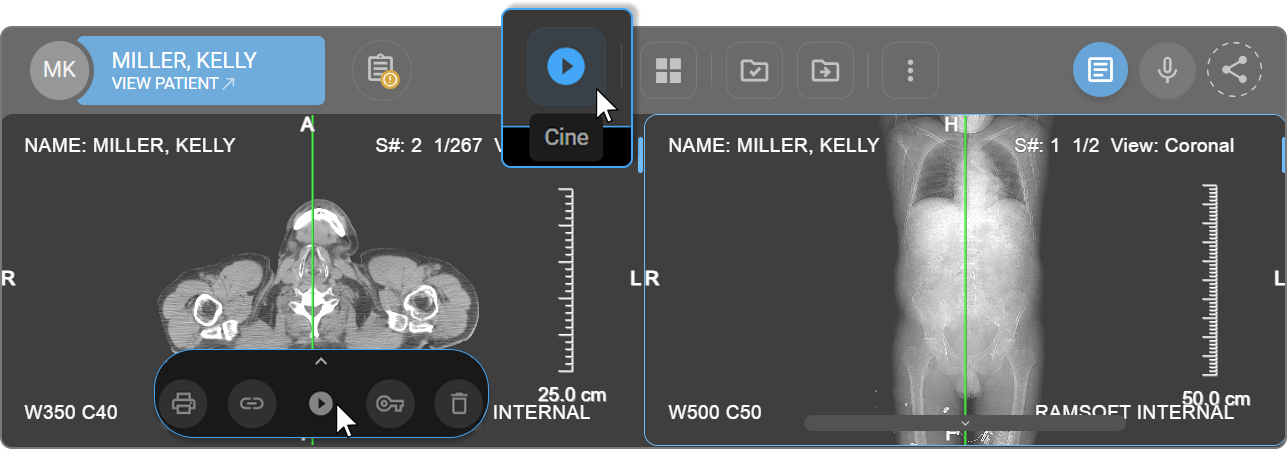
The Cine tool plays a multi-frame image series as a continuous loop, similar to video playback. It supports dynamic study reviews across modalities such as CT, MRI, fluoroscopy, and ultrasound — allowing users to observe motion, detect interval changes, and assess abnormalities across sequential frames.
How to Access
- From the Viewport Menu — click the Cine icon at the bottom of the active viewport.
- From the toolbar — add via Customize Toolbar, then click Cine. Alternatively, press C.
The Cine tool is only available when the loaded study contains more than two images.
How to Use
- Select Cine from the Viewport Menu, Toolbar, or press C.
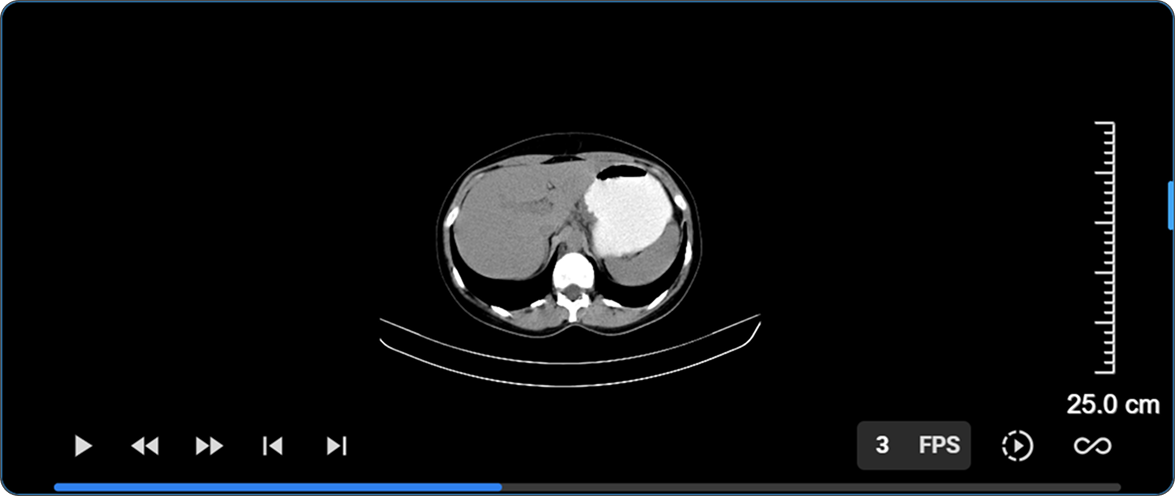
- A progress bar appears at the bottom of the viewport, indicating the current playback position within the series.
- Use the playback controls on the left side of the progress bar to navigate the series.
- Use the settings controls on the right side to adjust playback speed and method.
Playback Controls
The following controls are located on the left side of the progress bar:
| Control | Description |
|---|---|
| Start / Pause | Starts or pauses continuous playback |
| Previous Frame | Steps one frame backward in the sequence |
| Next Frame | Steps one frame forward in the sequence |
| First Frame | Jumps to the beginning of the series |
| Last Frame | Jumps to the end of the series |
Playback Settings
The following settings are located on the right side of the progress bar:
| Setting | Description |
|---|---|
| FPS | Displays the current playback speed in frames per second. Hovering over the FPS display reveals a slider — drag left to decrease or right to increase. The value can also be entered directly by clicking the FPS field. |
| Playback Speed | Sets the speed relative to the original frame rate. Options: 0.5x (half speed), Normal, 1.5x, or 2x (double speed). |
| Playback Method | Defines behaviour at the end of the sequence. Loop — repeats continuously from the beginning; Bounce — plays forward then reverses direction; Play Once — plays through once and stops at the last frame. |
The FPS value is automatically derived from the DICOM data of the active series. If no FPS information is available, a default value is applied based on the series modality.
3. Copy
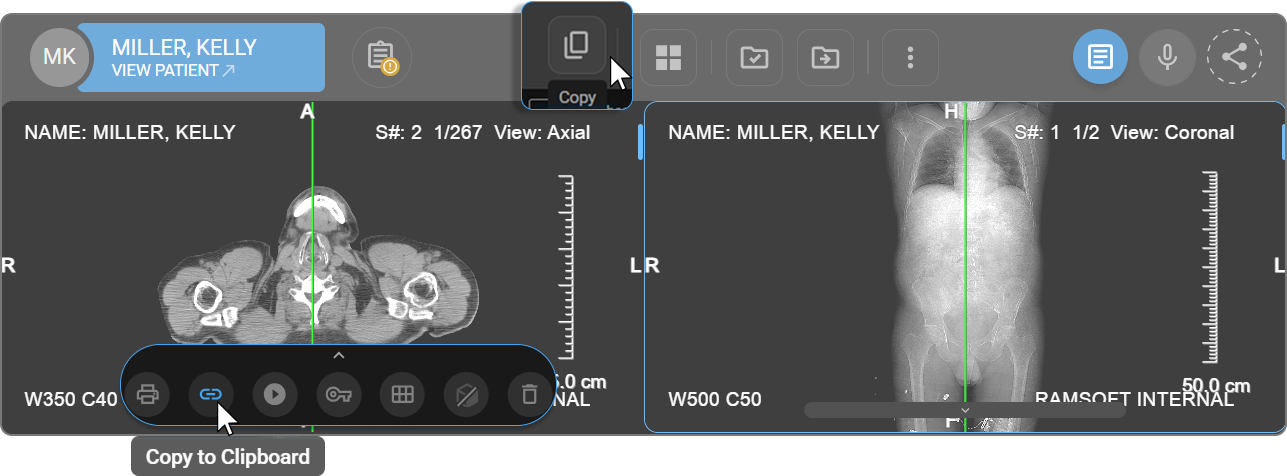
The Copy tool captures the currently displayed image — including all visible annotations and measurements — from the active viewport and places it on the system clipboard. The copied image can be pasted directly into reports, presentations, emails, or messaging applications.
Tip: To hide specific measurements before copying, use the eye icon next to each entry in the Measurement Panel.
How to Access
- From the Viewport Menu — click the Copy icon at the bottom of the active viewport.
- From the toolbar — add via Customize Toolbar, then click Copy.
How to Use
- Click anywhere inside the viewport to activate it.
- Click Copy from the Viewport Menu or Toolbar.
- A "Copied to Clipboard" confirmation message appears. The image is ready to paste.
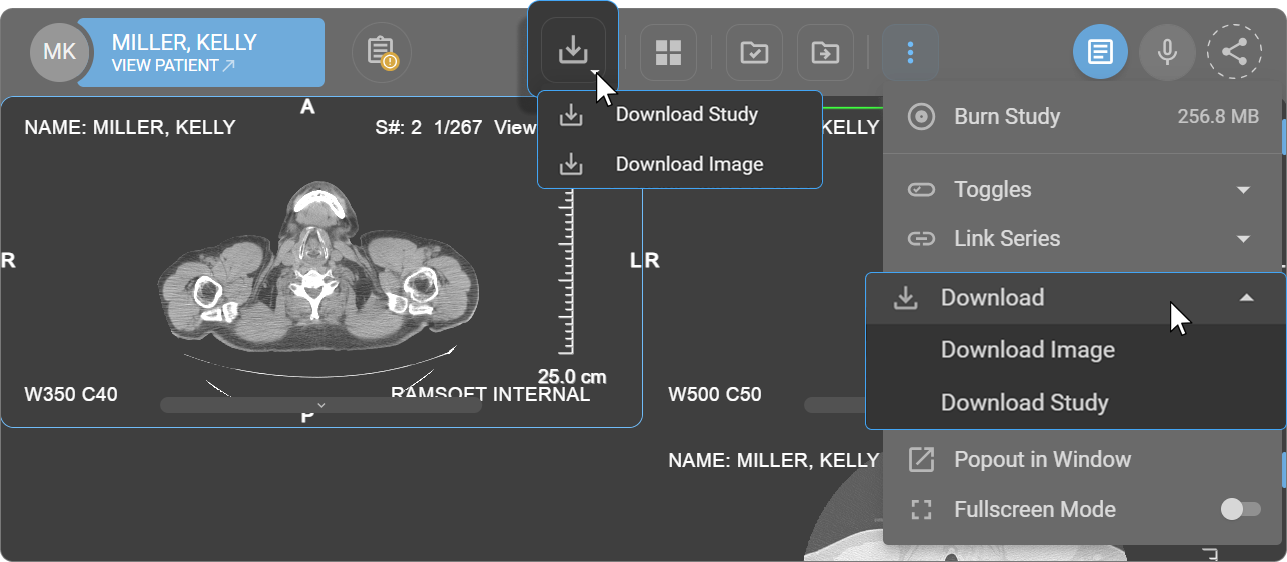
4. Download
The Download tool exports imaging content directly from the Image Viewer for sharing, reporting, or offline reference. Two export options are available.
How to Access
- From the toolbar — add via Customize Toolbar, then click Download.
- From the More Options menu — click ⋯ → Download.
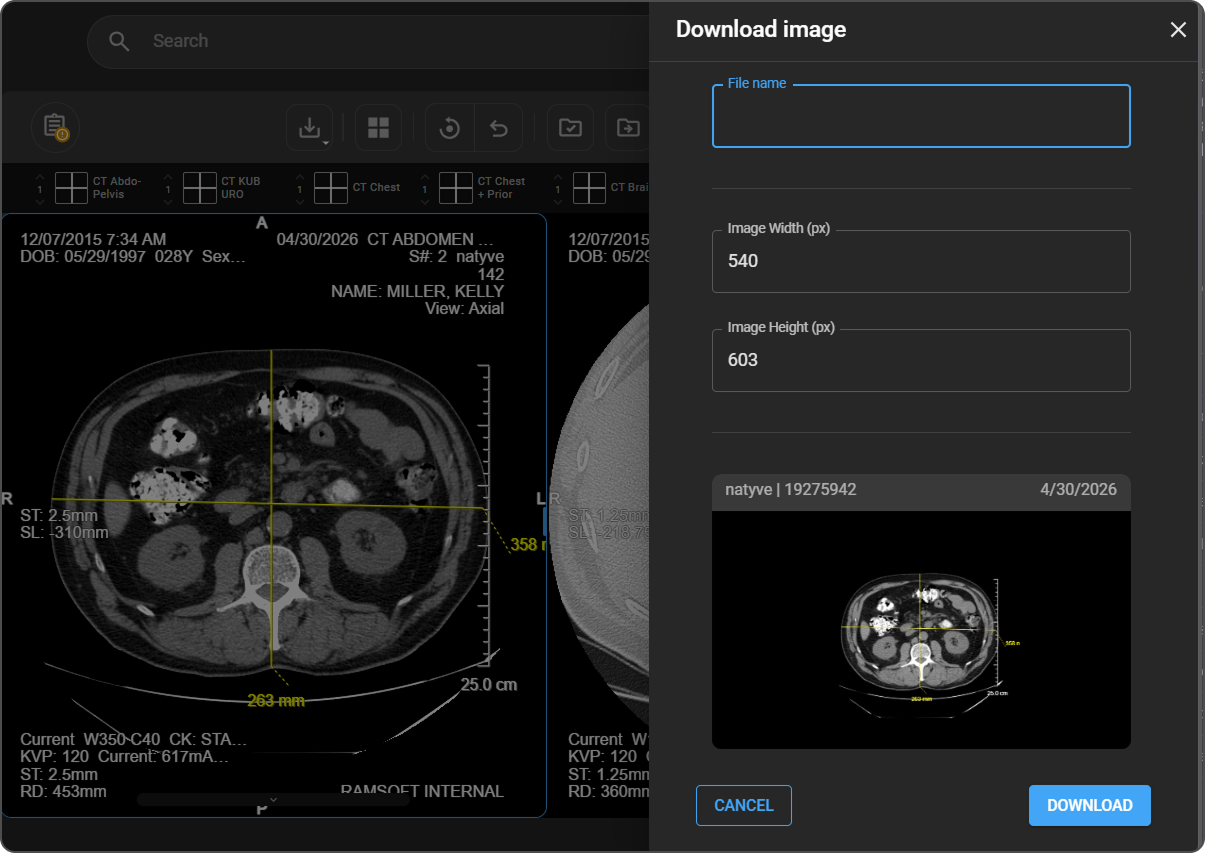
Download Image
Exports the image currently displayed in the active viewport, including all visible annotations and measurements.
Tip: To hide specific measurements before downloading, use the eye icon next to each entry in the Measurement Panel.
- Click Download and select Download Image.
- The Download Image dialog appears. Configure the following options:
| Option | Description |
|---|---|
| File Name | Enter the name of the exported file |
| Image Width (px) | Adjust the pixel width if resizing is required |
| Image Height (px) | Adjust the pixel height if resizing is required |
| Preview | Displays a thumbnail of the selected image with the series name, ID, and date |
- Click Download to save the file, or Cancel to exit.
Download Study
Downloads the complete study — including all series and images — in DICOM format. Intended for sharing the full dataset with other systems or creating offline archives.
The Download Study feature is also available directly from the Worklist. See Download Study.
Learn more about how to access DICOM files exported from OmegaAI.
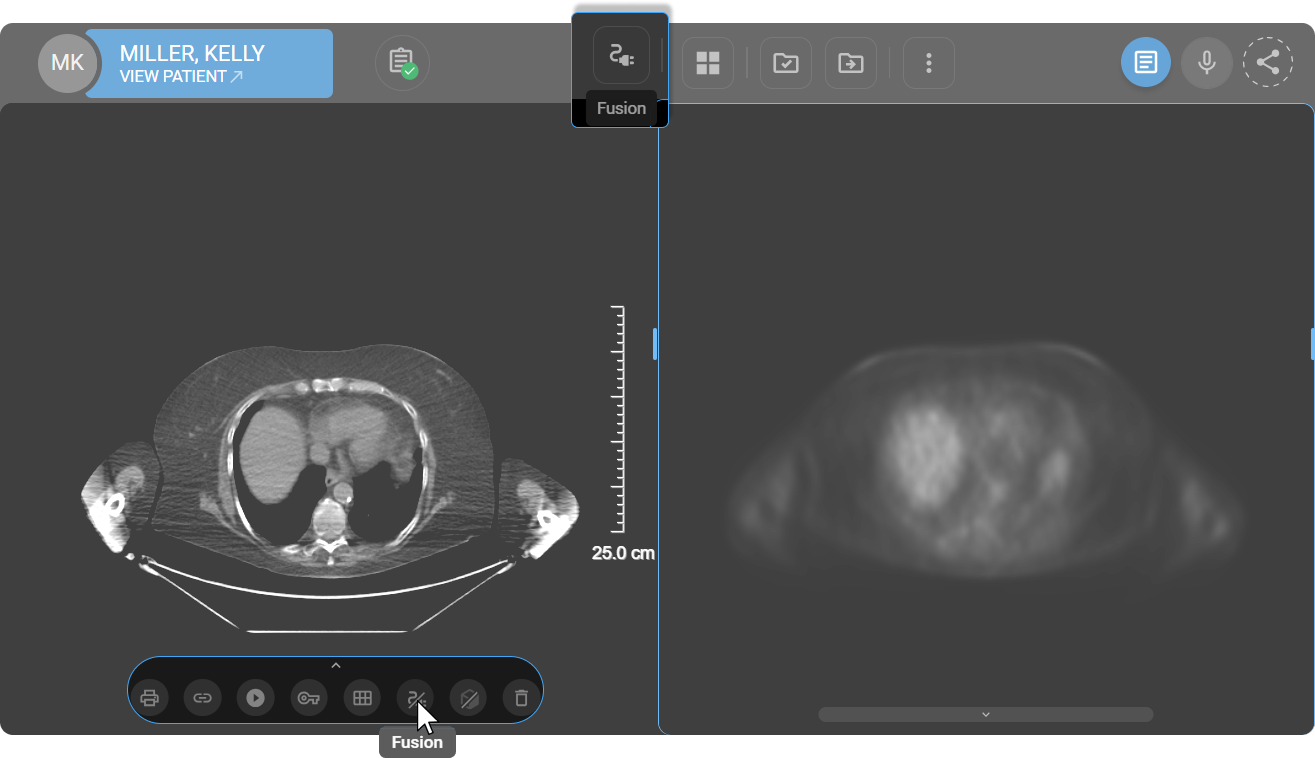
5. Fusion
PET-CT Fusion Mode overlays a color-mapped PET image onto the corresponding CT image, enabling simultaneous visualization of metabolic activity and anatomical structures within a single viewport.
How to Access
- From the Viewport Menu — the Fusion button appears at the bottom of the viewport when a PET and CT series from the same study are displayed side by side.
- From the toolbar — add via Customize Toolbar, then click Fusion.
To learn more, see PET-CT Fusion Mode.
6. Key Image
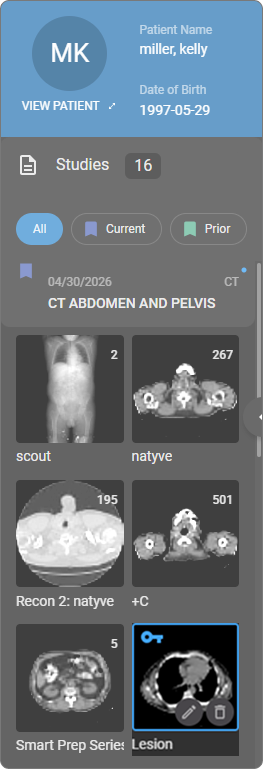
The Key Image tool marks a specific image or frame within a series as clinically significant. Marked images are saved in the Study Explorer under the corresponding study, making them readily accessible for reporting, follow-up review, and clinical communication.
How to Access
- From the Viewport Menu — click the Key Image icon at the bottom of the active viewport.
- From the toolbar — add via Customize Toolbar, then click Key Image.
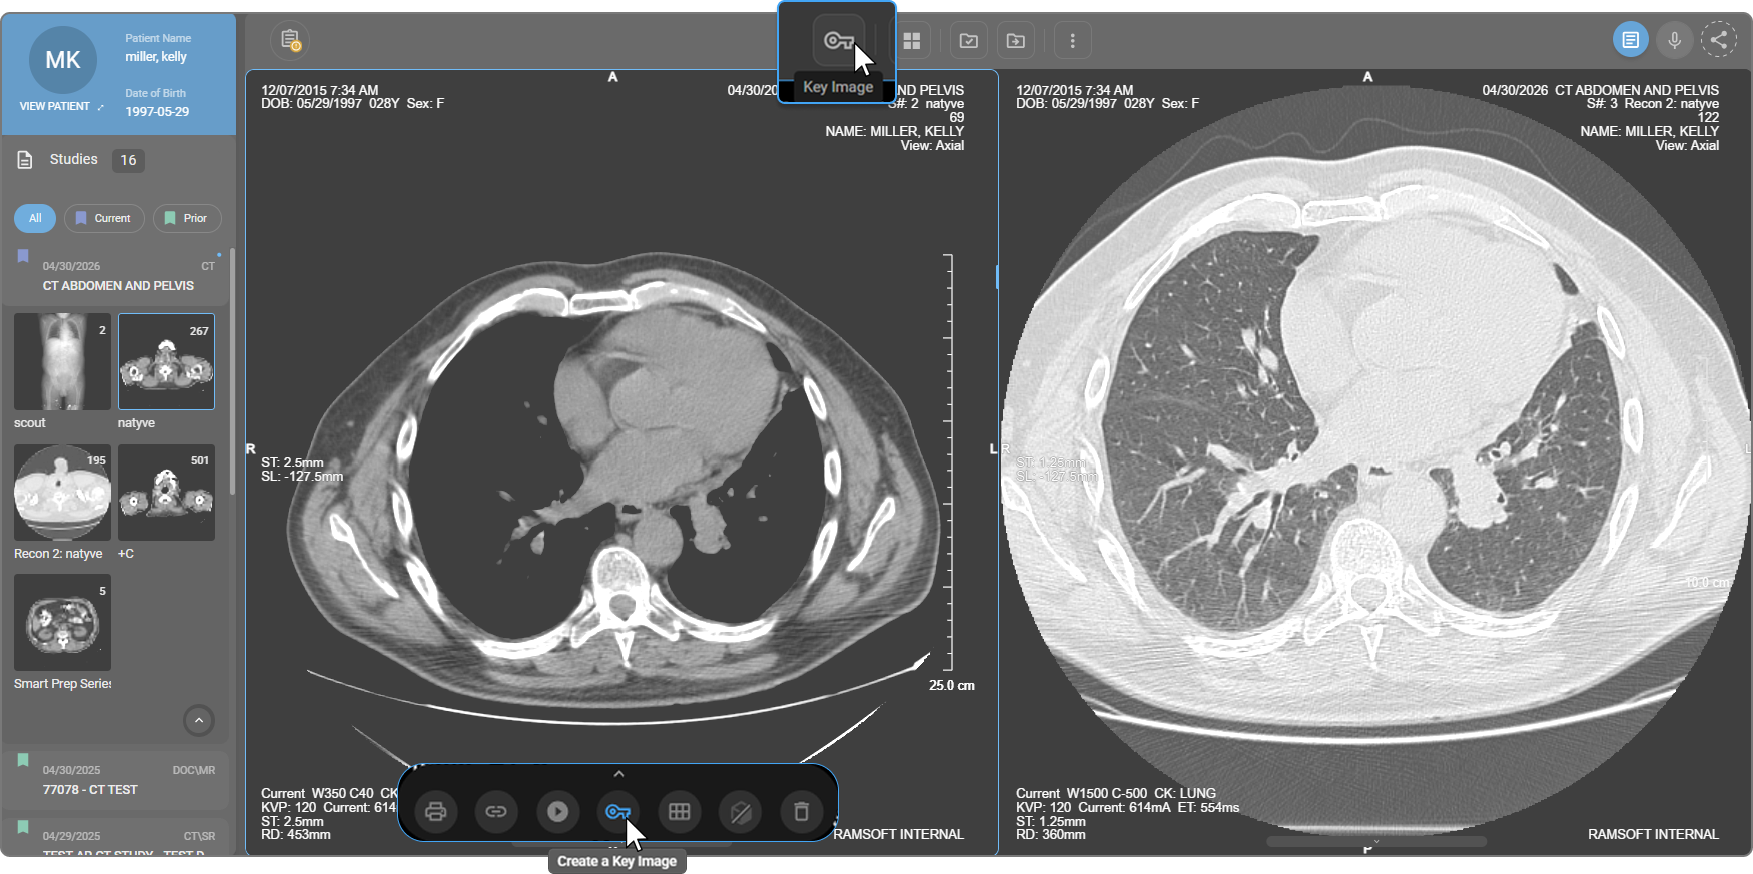
Creating a Key Image
|
|
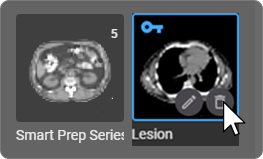
Removing a Key Image
|
|
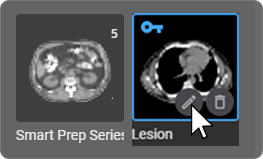
Renaming a Key Image
|
|
7. Link
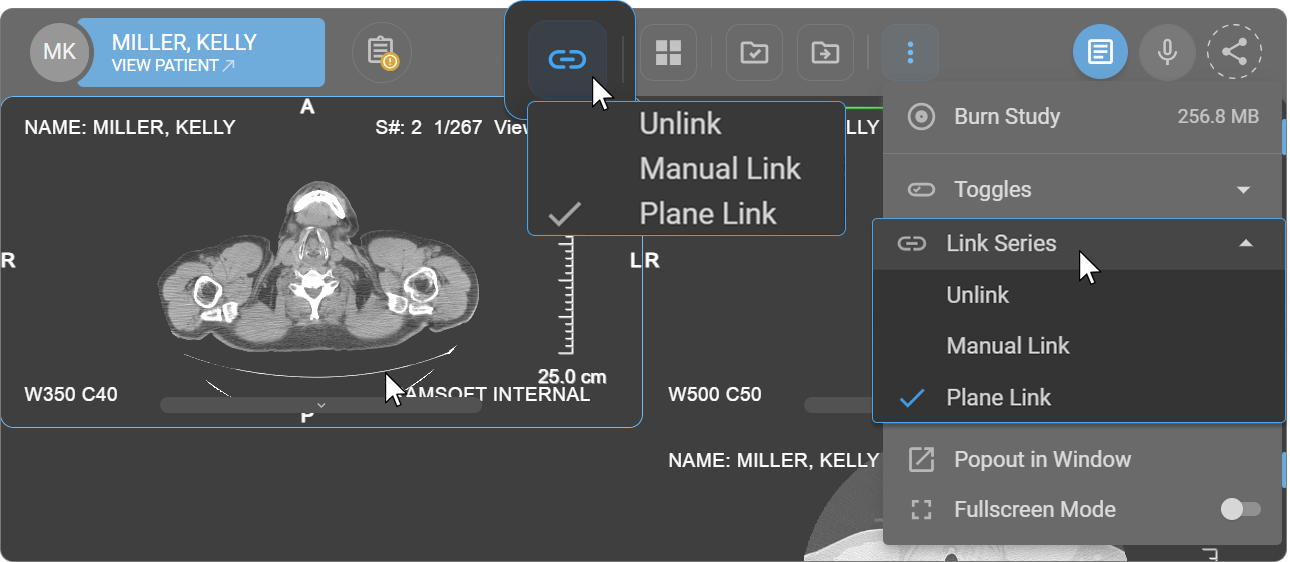
The Link tool synchronizes multiple viewports so that interactions — such as scrolling, zooming, and panning — are mirrored across all linked viewports simultaneously. It supports efficient side-by-side comparisons of images from different time points, modalities, or anatomical regions.
How to Access
- From the toolbar — add via Customize Toolbar, then click Link.
- From the More Options menu — click ⋯ → Link Series.
How to Use
Click the Link icon and select one of the following modes:
| Mode | Description |
|---|---|
| Unlink | Disables synchronization between all viewports |
| Manual Link | Allows users to manually select which viewports to link for synchronized viewing |
| Plane Link | Links viewports based on anatomical planes (axial, sagittal, coronal), enabling coordinated multi-plane navigation |
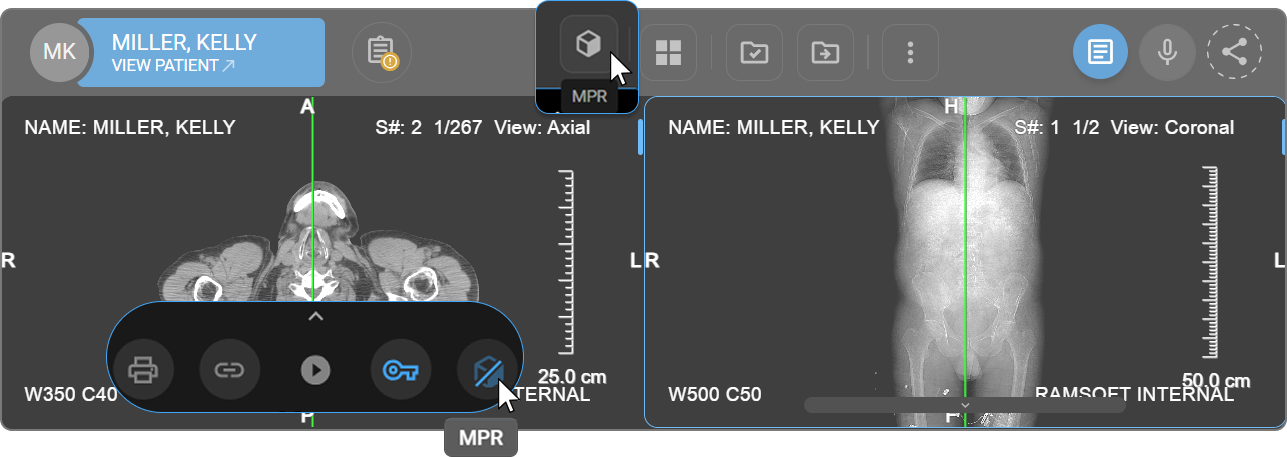
8. MPR (Multi-Planar Reconstruction)
MPR Mode reconstructs volumetric imaging data — such as CT — and displays it simultaneously across axial, sagittal, and coronal planes, enabling comprehensive spatial assessment of three-dimensional anatomy.
How to Access
- From the Viewport Menu — click the MPR icon at the bottom of the active viewport.
- From the toolbar — add via Customize Toolbar, then click MPR.
To learn more, see Multi-Planar Reconstruction (MPR).
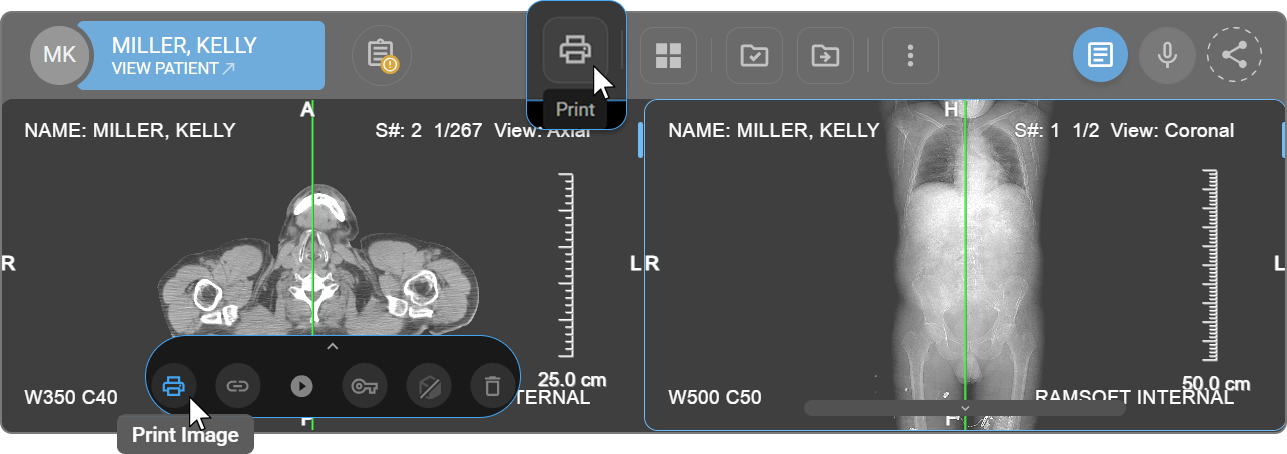
9. Print
The Print tool generates a hard copy of the currently displayed image, including all visible annotations and measurements. It is used for case documentation, multidisciplinary discussions, and offline references.
Tip: To hide specific measurements before printing, use the eye icon next to each entry in the Measurement Panel.
How to Access
- From the Viewport Menu — click the Print icon at the bottom of the active viewport.
- From the toolbar — add via Customize Toolbar, then click Print.
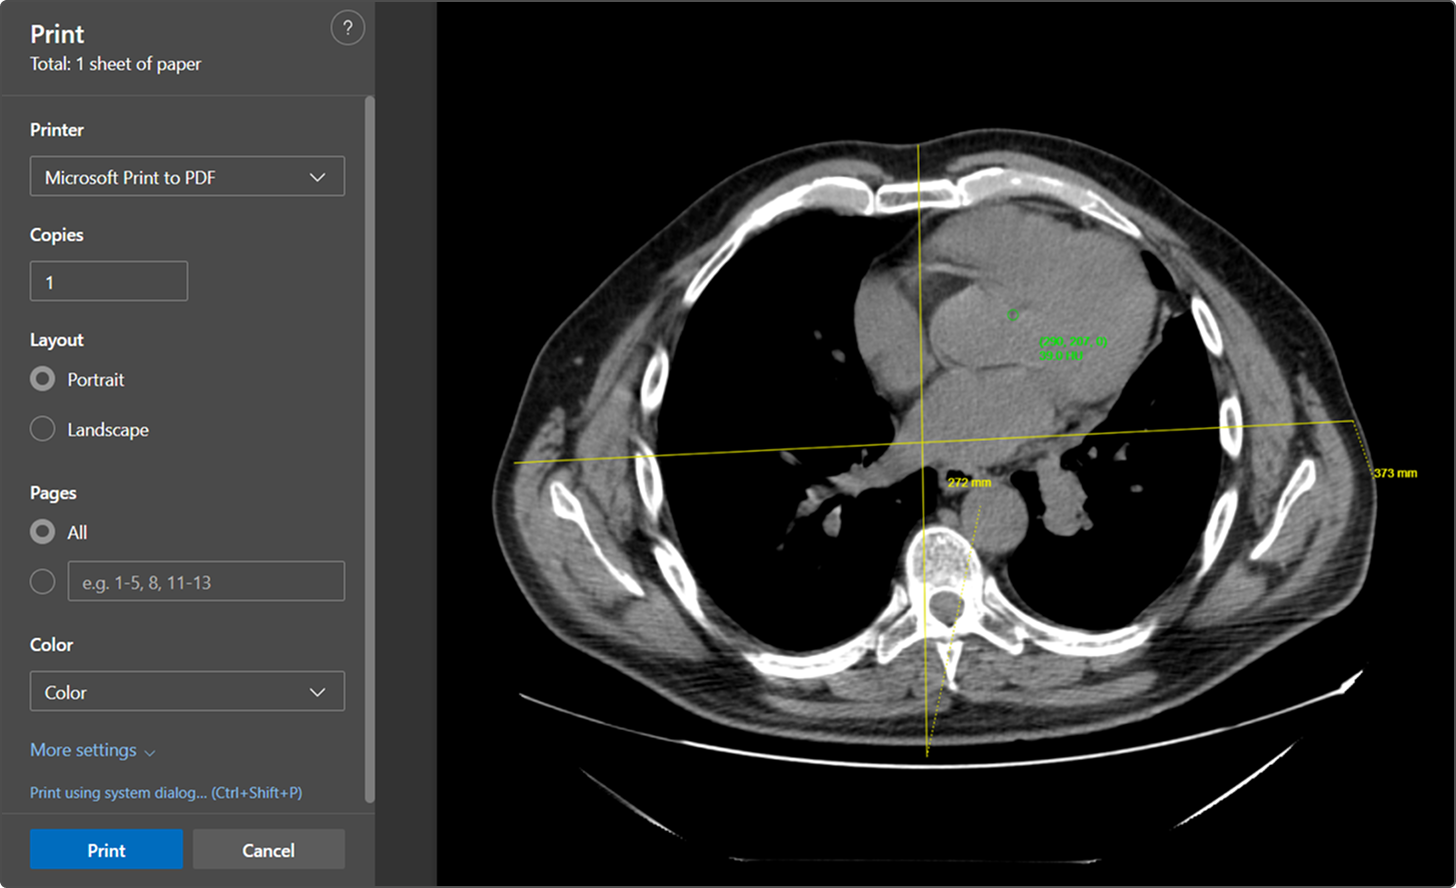
How to Use
- Click Print from the Viewport Menu or Toolbar.
- A print preview window opens, displaying the selected image with all annotations.
- Confirm the correct image is shown in the preview.
- Select the desired printer, page layout, and print settings.
- Click Print to send the image to the printer.
10. Tile Mode
Tile Mode divides the active viewport into a configurable grid of sub-viewports, allowing multiple images or series to be displayed simultaneously. It is used for side-by-side comparison across different studies, time points, or anatomical regions without requiring additional monitor space.
How to Access
- From the Viewport Menu — click the Tile Mode icon at the bottom of the active viewport.
- From the toolbar — add via Customize Toolbar, then click Tile Mode.
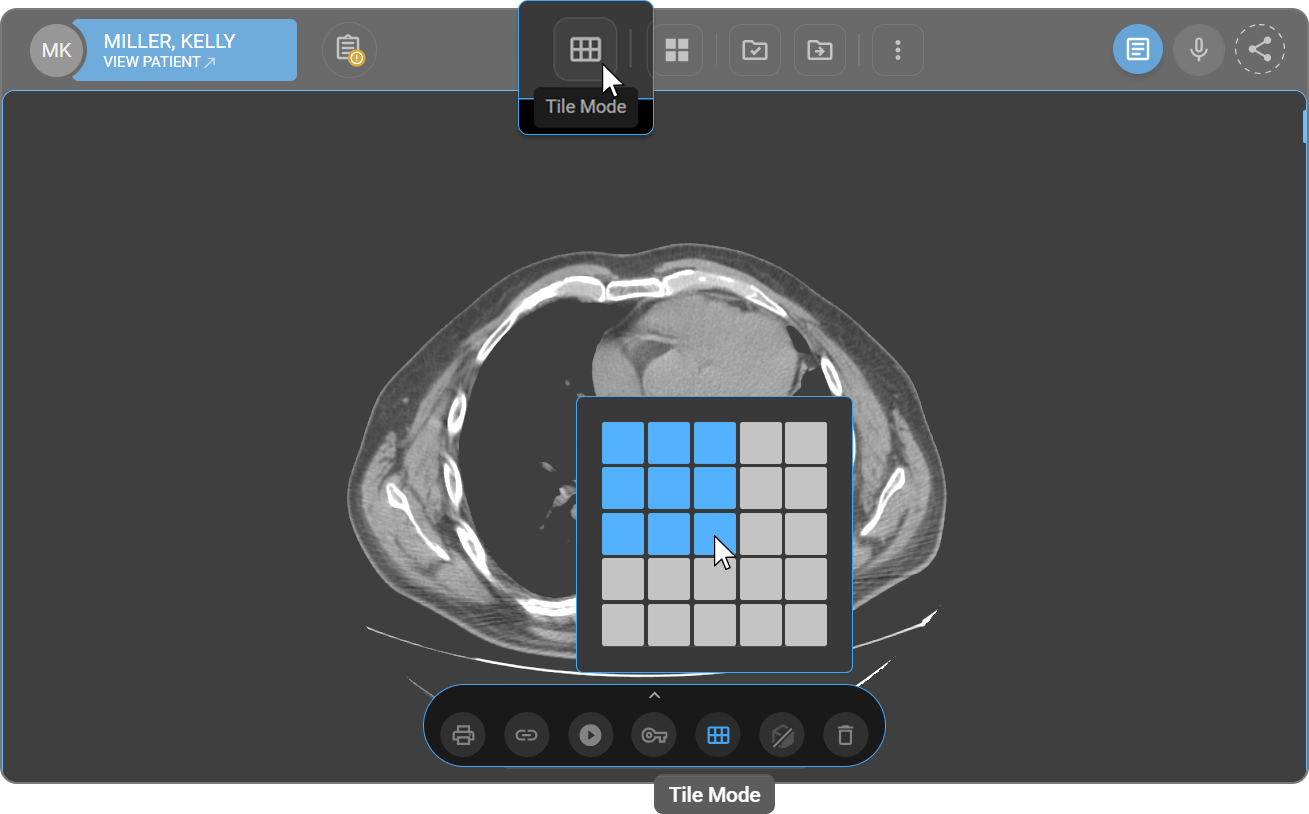
How to Use
- Click Tile Mode from the Viewport Menu or Toolbar.
- A grid selector appears — blue squares represent active viewports, and grey squares indicate inactive positions.
- Click the desired grid configuration to apply it.
- The viewport updates to display the selected layout.
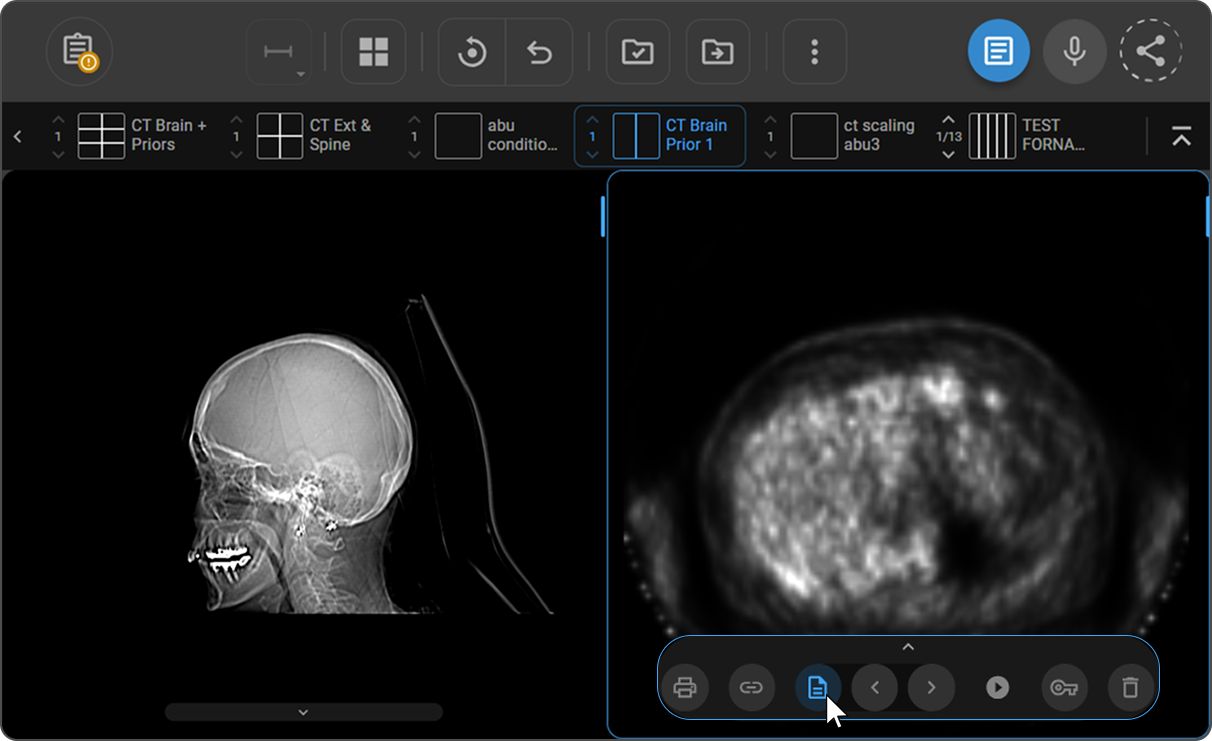
11. Prior Study Navigation
The Prior Navigation tool allows users to move forward and backward through prior study sets directly from the viewport, without reopening the study or navigating away from the Image Viewer. All viewports displaying the same prior study update simultaneously when navigation occurs.
Prior study sets are loaded into viewports based on the Prior Matching Model configured in the active Hanging Protocol. To learn more, see Select a Prior Matching Model.
How to Access
- From the Viewport Menu — click the Prior Navigation icon at the bottom of the active viewport. Two arrow icons appear: < (left) to go to the previous prior set and > (right) to go to the next prior set.
- Keyboard shortcuts — press [ to go to the previous prior set, or ] to go to the next prior set.
How to Use
- Click the > (right) icon or press ] to display the next prior study set. All viewports showing the same prior switch to the first image of the new set, following the viewport configuration defined by the active hanging protocol.
- Click the < (left) icon or press [ to return to the previous prior study set. If the first prior is already displayed, clicking left has no effect.
Note: Keyboard shortcuts [ and ] have no effect when the active viewport is displaying the current study — they apply only to viewports showing prior studies.