Adjustment & Markup Tools
Overview
OmegaAI provides two categories of image interaction tools within the Image Viewer:
Adjustment Tools control how images are displayed — enabling users to fine-tune brightness, contrast, orientation, zoom, and other visualization parameters for precise image interpretation.
Markup Tools allow users to annotate and measure directly on images — supporting accurate documentation of findings, clinical measurements, and reporting workflows.
Accessing the Tools
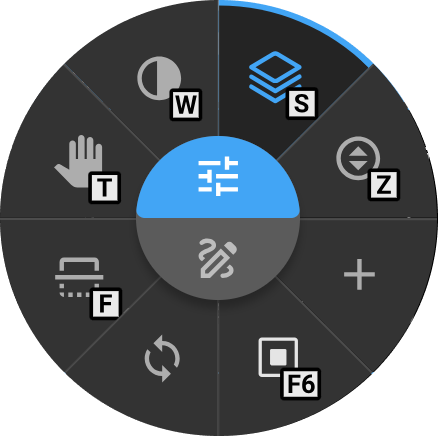
1. Image Control Wheel
- Open any study or series in the Image Viewer.
- Right-click on the image viewport — the Image Control Wheel appears instantly.
- Select the desired Adjustment or Markup tool from the wheel.
To personalize which tools appear on the wheel, see Customize Image Control Wheel.
2. From the Toolbar
Adjustment and Markup tools are not available in the toolbar by default and must be added through toolbar customization.
- Go to More Options (⋯) → Settings → Customize Toolbar.
- Add the desired Adjustment or Markup tools to the toolbar.
- Once added, click the tool from the toolbar to activate it.

To learn how to add tools to the toolbar, see Customize Toolbar.
Quick Reference
Click any tool name to jump directly to its detailed description.
Adjustment Tools
| Tool | Default Hotkey |
|---|---|
| Pan | T |
| Stack Scroll | S |
| Window / Level | W |
| Clamped Window Level | — |
| Crosshair | J |
| Crosshair Pointer | — |
| Free Rotate | — |
| Zoom | Z |
| Magnify | M |
| Invert | \ |
| Shutter | F6 |
| Quad Zoom | K |
| Flip Horizontal / Vertical | H / F |
Markup & Measurement Tools
| Tool | Default Hotkey |
|---|---|
| Length | D |
| Angle | A |
| Plumb Line | — |
| Cobb's Angle | Ctrl + A |
| ROI | G / E / — / — |
| Bidirectional | B |
| Cardiothoracic Ratio | ; |
| Probe | Q |
| Drag Probe | X |
| Spine Labelling | — |
| Annotate | Numpad / |
| M-Mode | — |
To configure custom shortcuts, see Hotkey Customization.
Adjustment Tools
1. Pan
The Pan tool allows you to move or reposition the image freely within the viewport without altering its zoom level or orientation. It is especially useful when working with zoomed-in images, enabling you to navigate to areas that extend beyond the visible boundaries of the viewport.
How to Access
- From the Image Control Wheel — right-click on the viewport and select Pan, or add it via Customize Wheel if not already available.
- From the toolbar — add via Customize Toolbar, then click Pan.
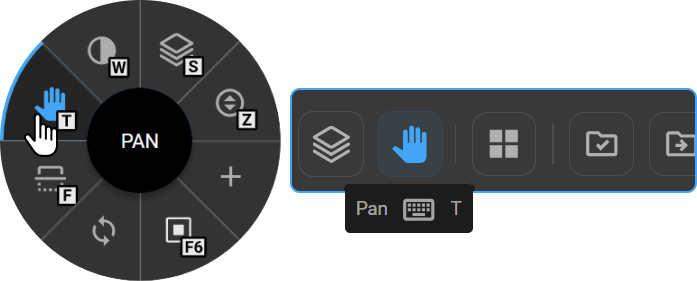
Hotkey: T
How to Use
- Select Pan from the Image Control Wheel, Toolbar, or press T.
- Click and hold the left mouse button on the image.
- Drag in any direction to reposition the image.
- Release the mouse button once the view is adjusted.
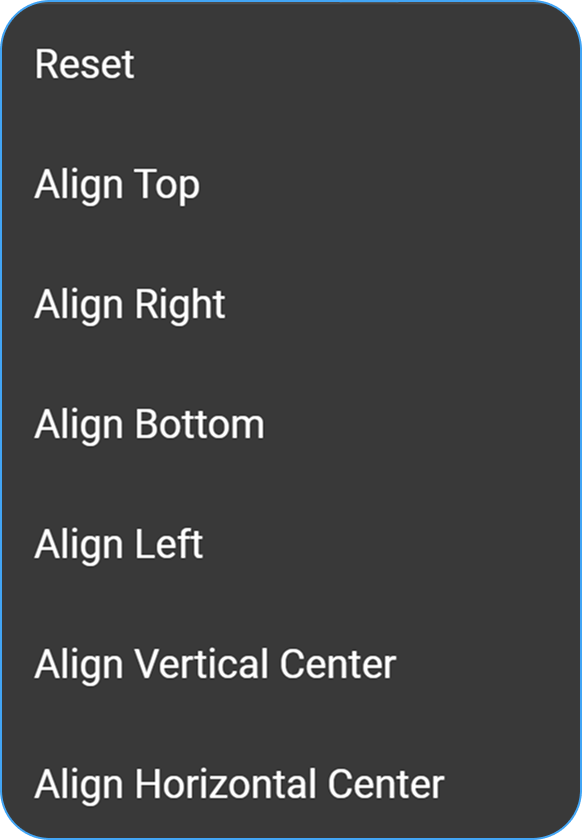
Alignment Menu
Left-clicking on the image while Pan is active opens the Alignment menu, providing quick repositioning options without manual dragging.
|
|
2. Stack Scroll
The Stack Scroll tool enables navigation through multi-frame image series, including CT, MRI, PT, and ultrasound cine loops. It supports three input methods — mouse drag, mouse wheel, and keyboard — giving users flexibility for reviewing sequential slices or frames.
How to Access
- From the Image Control Wheel — right-click on the viewport and select Stack Scroll, or add it via Customize Wheel if not already available.
- From the toolbar — add via Customize Toolbar, then click Stack Scroll.
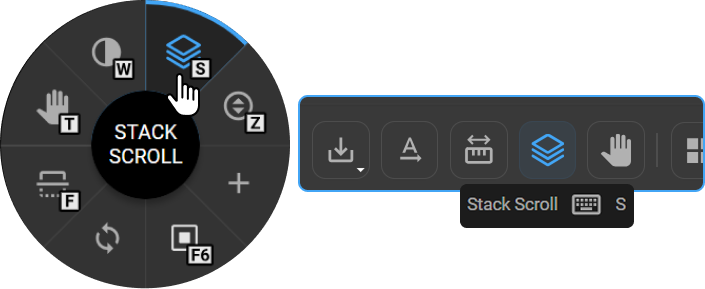
Hotkey: S
How to Use
Select the Stack Scroll tool from the Image Control Wheel, Toolbar, or press S.
- Mouse Scroll — Hover over the image and scroll the mouse wheel up or down. This method works regardless of the currently active tool, making it the most convenient option for rapid navigation.
- Click and Drag — Click and hold the primary mouse button, then drag up or down over the viewer to scroll through the stack.
- Keyboard Shortcuts — Use the Left / Right arrow keys to advance or reverse one slice or frame at a time. Best suited for controlled, slice-by-slice review.
To learn more, see Link Series.
3. Window / Level
The Window / Level tool controls the brightness and contrast of medical images by adjusting the window center (level) and window width. It is one of the most frequently used tools in diagnostic imaging, allowing radiologists to optimize image display for specific tissue types, anatomical regions, or pathological findings.
How to Access
- From the Image Control Wheel — right-click on the viewport and select Window Level, or add it via Customize Wheel if not already available.
- From the toolbar — add via Customize Toolbar, then click Window Level.
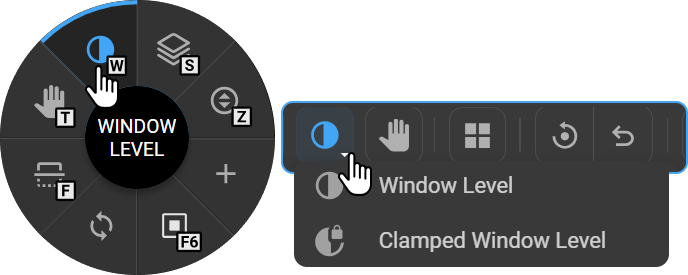
Hotkey: W
How to Use
- Select Window Level from the Image Control Wheel, Toolbar, or press W.
- Click and hold the left mouse button on the image.
- Move the mouse horizontally to adjust contrast.
- Move the mouse vertically to adjust brightness.
- Release the mouse once the image is optimized.
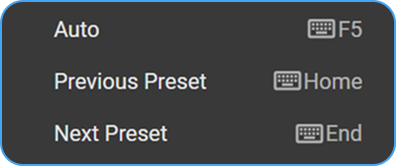
Window Level Presets
Left-clicking while the Window Level tool is active opens the Presets menu:
|
|
Default CT Presets
|
|
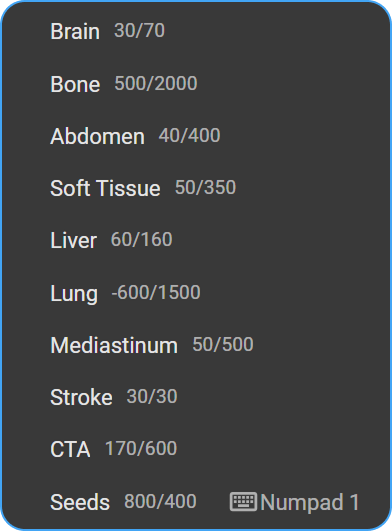
User-defined custom presets also appear in this list.
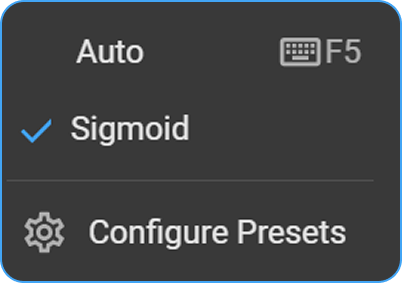
Sigmoid Adjustment
Available for DX, MG, and CR modalities only. Left-click the image while Window Level is active to access this option.
Sigmoid adjustment applies nonlinear scaling for more precise brightness and contrast control, particularly in areas with high-density variation. It is especially useful in soft tissue imaging, where fine contrast control helps highlight subtle density differences.
Creating a Custom Preset
- While the Window Level tool is active, right-click on the image to open the Window Level Presets menu and select Configure Presets.
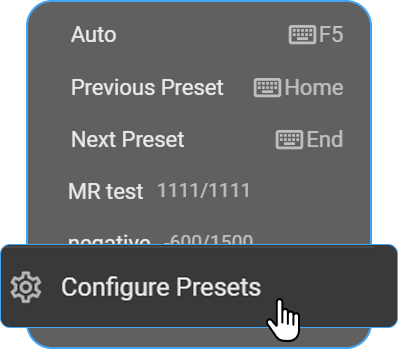
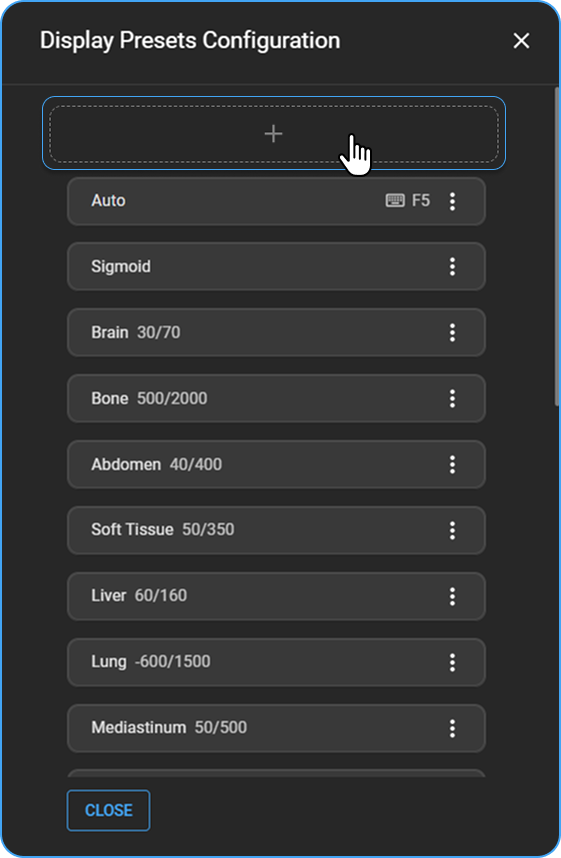
- The Display Presets Configuration panel opens on the right side of the screen, listing all existing presets.
- Click the + button to add a new preset.
- Enter a descriptive preset name.
- Select the imaging modality the preset applies to (e.g., CT, MR).
- Enter the Window Level (WL) value — controls the brightness of the image (center of the grayscale range).
- Enter the Window Width (WW) value — controls the contrast (range of intensities displayed).
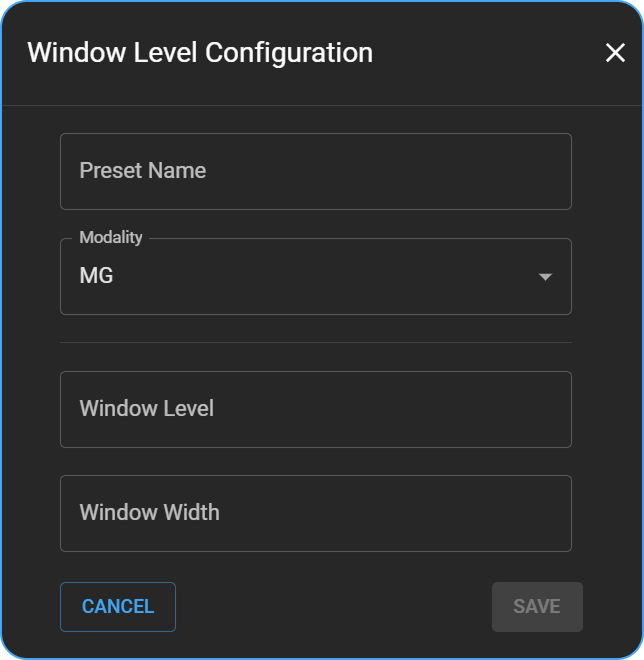
- Click Save to add the new preset to the list.
Assigning a Keybind to a Preset
- Open the Window Level Configuration drawer.
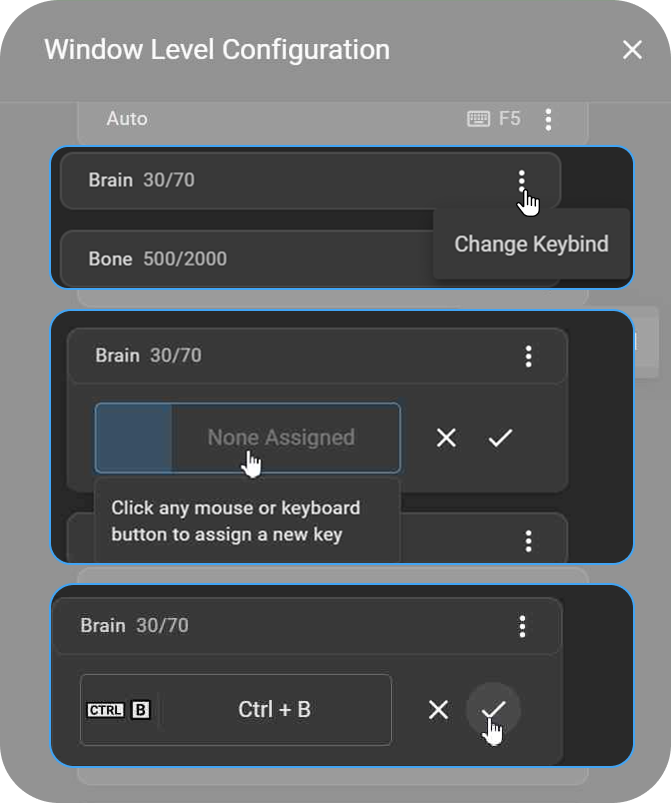
- Locate the preset you want to assign or modify.
- Click the ⋮ menu next to the preset and select Change Keybind.
- A keybind entry box appears under the preset.
- Press the desired key or key combination on your keyboard.
- Click ✓ to save the new keybind, or × to cancel.
The preset is updated with your custom keybind for quick access during image review.
Deleting a Preset
Only custom presets can be deleted. System presets cannot be removed.
- Open the Display Presets Configuration panel.
- Locate the custom preset you want to remove.
- Click the ⋮ menu next to the preset.
- Select Delete — the preset is immediately removed from the list.
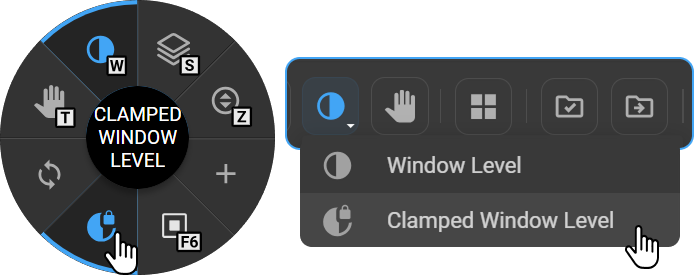
4. Clamped Window Level
The Clamped Window Level tool is a specialized variant of the standard Window Level tool that applies fixed upper and lower intensity bounds. This bounded approach prevents extreme brightness or contrast values, making it particularly useful for modalities where controlled intensity mapping is important, such as CT, NM, and PET studies.
Supported modalities: CT, NM, PET-CT (CT component only), PT
How to Access
- From the Image Control Wheel — right-click on the viewport and select Clamped Window Level, or add it via Customize Wheel if not already available.
- From the toolbar — add via Customize Toolbar, then click Clamped Window Level.
Key Features
-
Clamped Adjustment — Brightness and contrast range is bounded within defined limits.
- Lower Bound (L): 0 (default)
- Upper Bound (U): WL + (WW / 2)
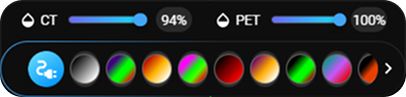
-
Color Map Support (PT Studies) — A color map bar appears at the bottom of the viewer displaying multiple color palette options. Click any palette to apply it to the PET overlay. Use the scroll arrow to browse additional color options.
-
Preset & Hanging Protocol Compatibility — Fully supports existing Window Level presets and maintains consistent display behavior across different layouts and multi-monitor setups.
-
Specialized Cursor — When the Clamped Window Level tool is active, the cursor changes to a dedicated icon with a rotation arrow, distinguishing it from the standard Window Level cursor.

How to Use
- Open any supported study (CT, NM, PET-CT, or PT).
- Select Clamped Window Level from the Image Control Wheel or Toolbar.
- Click and hold the left mouse button on the image.
- Move the mouse left or right to adjust the Upper Bound (U).
- Release the mouse once the image is optimized.
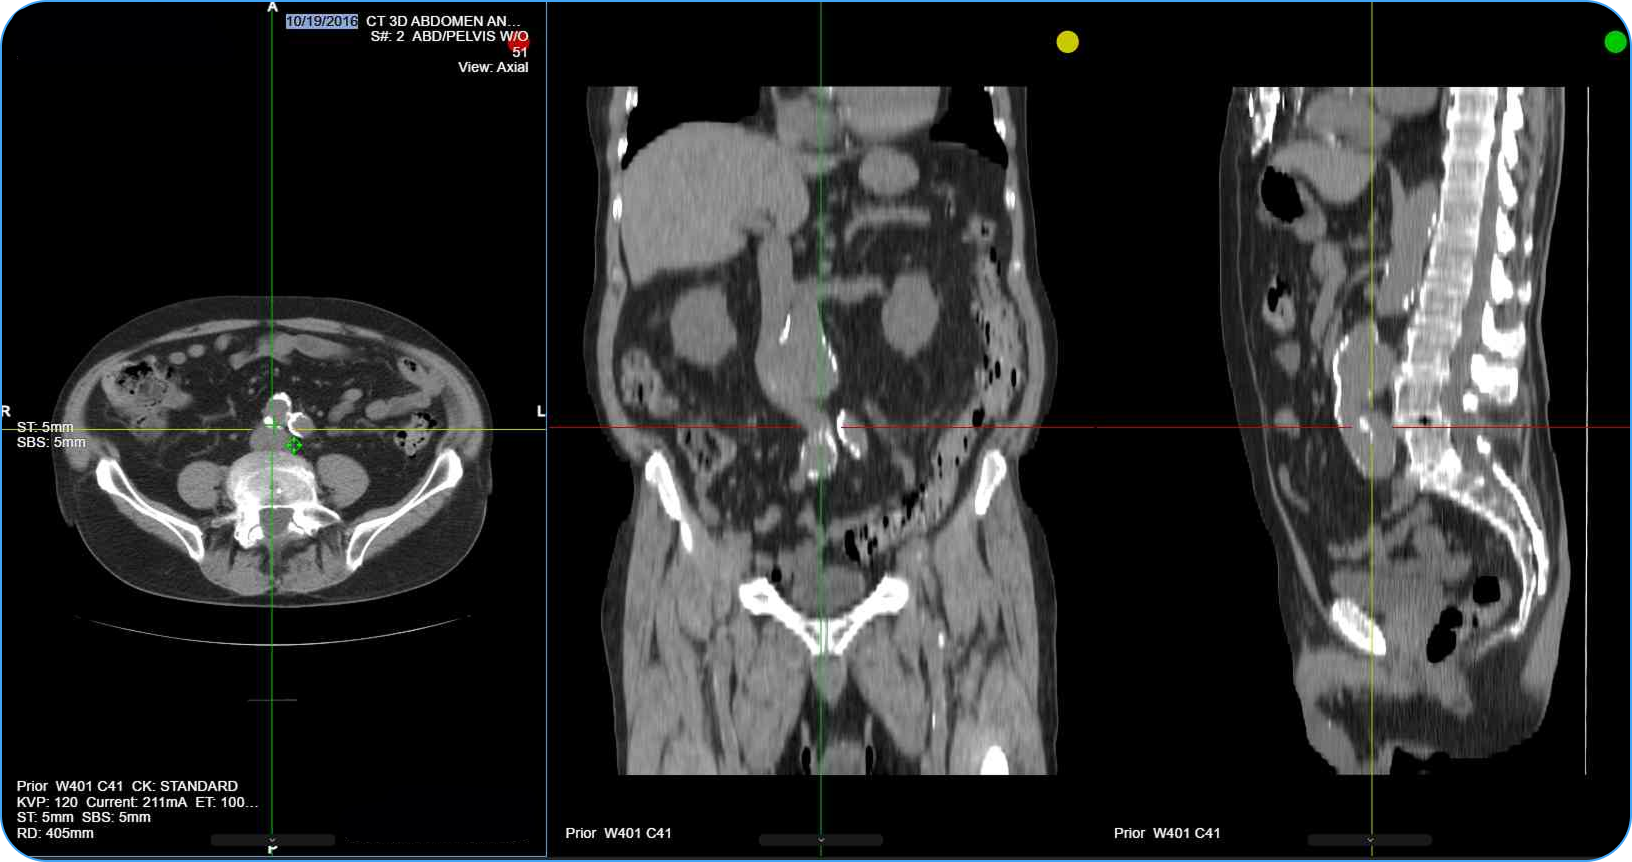
5. Crosshair
The Crosshair tool synchronizes the viewing position across multiple image planes — axial, sagittal, coronal, and oblique — so that clicking on a point in one viewport automatically updates all other linked viewports to display the corresponding anatomical location. It is available exclusively in MPR and Fusion Mode, where it activates automatically.
Each viewport displays color-coded reference lines and a corresponding dot indicator in the top corner to identify the plane:
| Indicator Color | Plane |
|---|---|
| Red | Axial |
| Yellow | Coronal |
| Green | Sagittal |
How to Access
- From the Image Control Wheel — right-click on the viewport and select Crosshair, or add it via Customize Wheel if not already available.
- From the toolbar — add via Customize Toolbar, then click Crosshair.
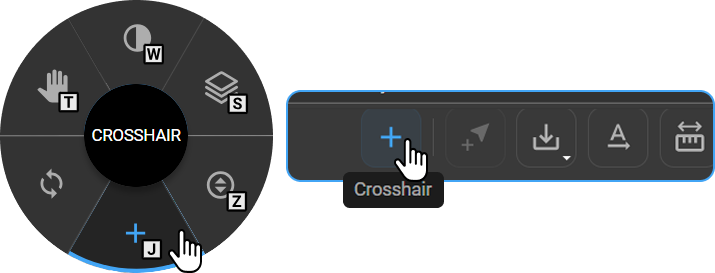
Hotkey: J
How to Use
- Activate MPR or Fusion Mode — the Crosshair tool enables automatically.
- Select Crosshair from the Image Control Wheel, Toolbar, or press J.
- Click and move the cursor to the desired anatomical position on any viewport.
- All linked planes update automatically to display the corresponding anatomical point.
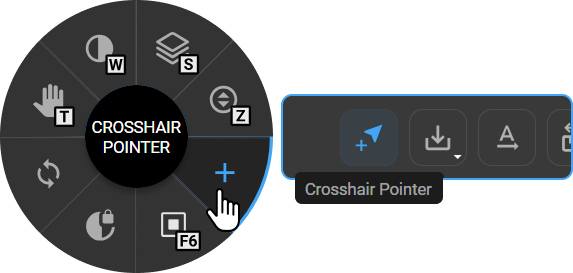
6. Crosshair Pointer
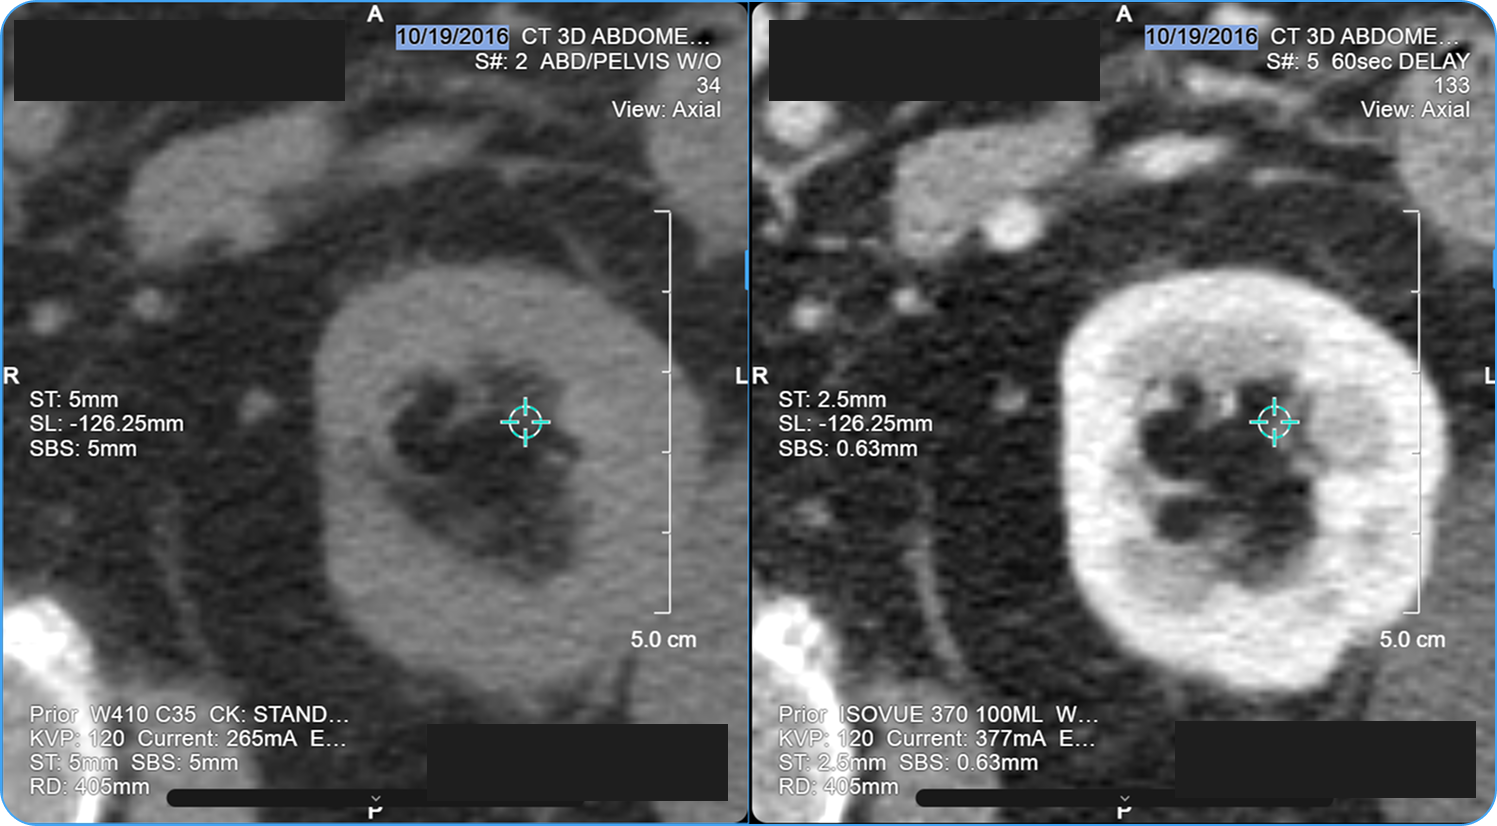
The Crosshair Pointer places a visual reference marker on a specific point within the image, displayed as a small crosshair with a circular center. When multiple viewports are displayed side by side, the marker appears at the same anatomical location across all linked viewports simultaneously — making it useful for visually correlating a point of interest between two studies or series during comparative review.
How to Access
- From the Image Control Wheel — right-click on the viewport and select Crosshair Pointer, or add it via Customize Wheel if not already available.
- From the toolbar — add via Customize Toolbar, then click Crosshair Pointer.
Hotkey: —
How to Use
- Select Crosshair Pointer from the Image Control Wheel or Toolbar.
- Click once on the image to place the pointer at the desired location.
- When comparing two aligned studies, the pointer appears at the same location in both viewports.
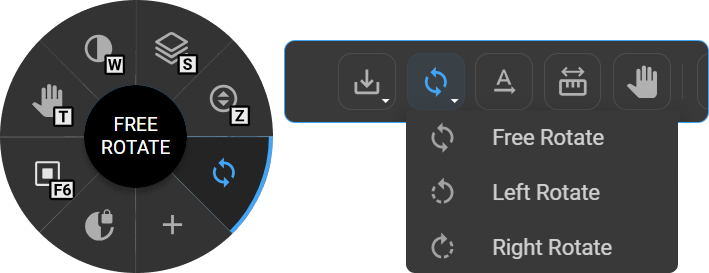
7. Free Rotate
The Free Rotate tool rotates the image to any viewing angle. It is commonly used to correct tilted or obliquely acquired images, align structures with standard anatomical reference planes, or reorient images to improve visualization of specific findings.
How to Access
- From the Image Control Wheel — right-click on the viewport and select Free Rotate, or add it via Customize Wheel if not already available.
- From the toolbar — add via Customize Toolbar, then click Rotate.
Hotkey:
- , (Comma) → Rotate Left (−90°)
- . (Period) → Rotate Right (+90°)
How to Use
- Select Free Rotate from the Image Control Wheel, Toolbar, or press the assigned shortcut key.
- Click and drag on the image to rotate it freely.
- Release the mouse to apply the rotation.
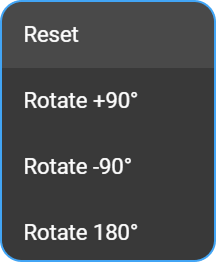
Right-click preset options:
|
|
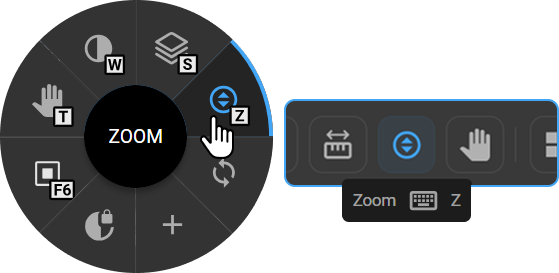
8. Zoom
The Zoom tool adjusts the magnification of the image for closer inspection. It is frequently used when close inspection of fine anatomical details is required, such as identifying microcalcifications in mammography, subtle mucosal changes in CT, or small nodules and vessels across various modalities.
How to Access
- From the Image Control Wheel — right-click on the viewport and select Zoom, or add it via Customize Wheel if not already available.
- From the toolbar — add via Customize Toolbar, then click Zoom.
Hotkey: Z
How to Use
- Select Zoom from the Image Control Wheel, Toolbar, or press Z.
- Click and drag — drag up to zoom out, drag down to zoom in.
- Release the mouse to apply.
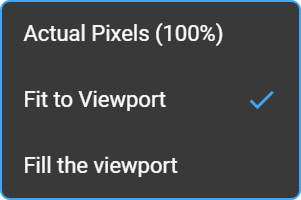
Left-click zoom options:
|
|
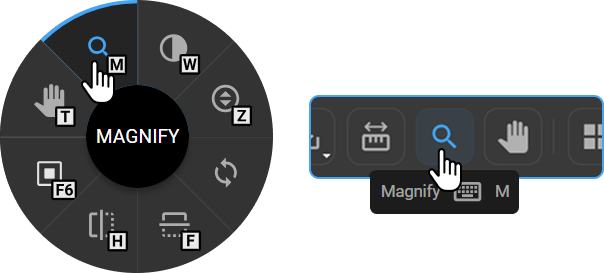
9. Magnify
The Magnify tool renders a floating square magnification window over the image, enlarging the area directly beneath it without affecting the zoom level of the rest of the viewport. This allows users to inspect fine details — such as vessel branching patterns, small nodules, or subtle tissue changes — while maintaining the full clinical context of the surrounding image.
How to Access
- From the Image Control Wheel — right-click on the viewport and select Magnify, or add it via Customize Wheel if not already available.
- From the toolbar — add via Customize Toolbar, then click Magnify.
Hotkey: M
How to Use
- Select Magnify from the Image Control Wheel, Toolbar, or press M.
- Click and drag over the area of interest — a square magnification window appears, enlarging the region beneath it.
- Move the cursor to reposition the magnification window over different areas.
- Release the mouse or switch to another tool to exit magnification mode.
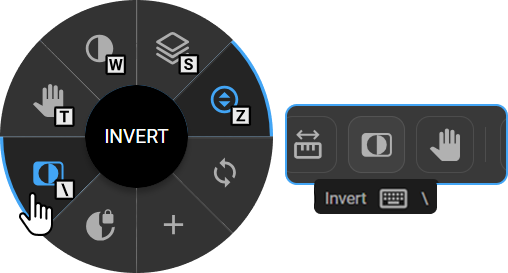
10. Invert
The Invert tool reverses the grayscale values of the displayed image, producing a photographic negative effect where bright structures appear dark and dark regions appear bright. This can improve the conspicuity of certain pathologies and anatomical structures that are more easily identified against an inverted background — particularly in plain radiography, fluoroscopy, and soft tissue CT imaging.
How to Access
- From the Image Control Wheel — right-click on the viewport and select Invert, or add it via Customize Wheel if not already available.
- From the toolbar — add via Customize Toolbar, then click Invert.
Hotkey: \ (Backslash)
How to Use
- Select Invert from the Image Control Wheel, Toolbar, or press ****.
- The image immediately switches to a negative grayscale view.
- Select the tool again to toggle back to the original view.
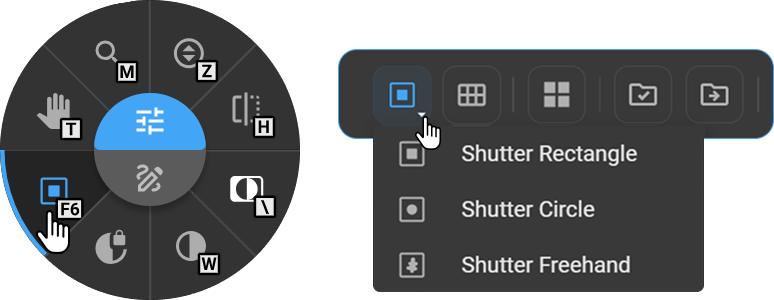
11. Shutter
The Shutter tool masks the area outside a user-defined region, isolating the region of clinical interest and darkening the surrounding non-diagnostic areas. Once applied, only the selected region remains visible within the viewport — the masked area is displayed as black. Three shutter shapes are available to accommodate different anatomical boundaries and clinical needs.
How to Access
- From the Image Control Wheel — right-click on the viewport and select Shutter, or add it via Customize Wheel if not already available.
- From the toolbar — add via Customize Toolbar, then click Shutter.
Hotkey: F6
How to Use
- Select Rectangle Shutter from the Image Control Wheel or Toolbar.
- Left-click once on the viewport to choose a shutter shape:
- Rectangle Shutter (default)
- Circle Shutter
- Freehand Shutter
- Click and drag on the image to draw the shutter region — the outline is visible while dragging.
- Release the mouse to apply. The area outside the shutter is masked black, leaving only the selected region visible.
To resize:
- Rectangle or Circle Shutter — hover over the border to reveal a circle handle, then click and drag the handle to resize.
- Freehand Shutter — click on the border and draw to reshape the shutter region.
12. Quad Zoom
The Quad Zoom tool is designed specifically for mammography review. It divides the image into four quadrants and cycles through each one at a zoomed-in magnification level, ensuring that every region of the breast is systematically examined without requiring manual pan and zoom adjustments.
How to Access
- From the Image Control Wheel — right-click on the viewport and select Quad, or add it via Customize Wheel if not already available.
- From the toolbar — add via Customize Toolbar, then click Quad.
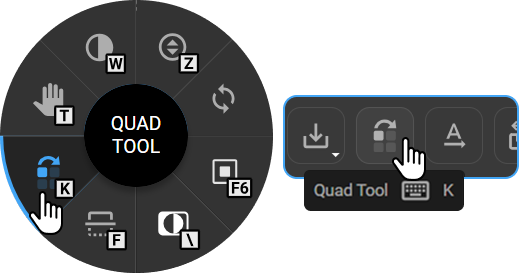
Hotkey: K
How to Use
- Open the mammography image and select Quad Zoom from the Image Control Wheel, Toolbar, or press K.
- Click once on the image to activate the tool. The viewer automatically zooms into the first quadrant based on the breast side and navigation direction.
Quadrant navigation:
| Breast Side | Starting Quadrant | Sequence | First Click Moves To | Cursor |
|---|---|---|---|---|
| Right Breast | Top Right | Clockwise | Bottom Right |  |
| Left Breast | Top Left | Anti-clockwise | Bottom Left |  |
Continue clicking to cycle through all quadrants in order. Press Esc to return to the full-image view.
13. Flip Horizontal / Vertical
The Flip tool mirrors the image along the horizontal or vertical axis. It is used to correct laterality presentation errors, match standard reading orientations across different acquisition protocols, or compare images acquired with opposing patient positioning.
How to Access
- From the Image Control Wheel — right-click on the viewport and select Flip, or add it via Customize Wheel if not already available.
- From the toolbar — add via Customize Toolbar, then click Flip.
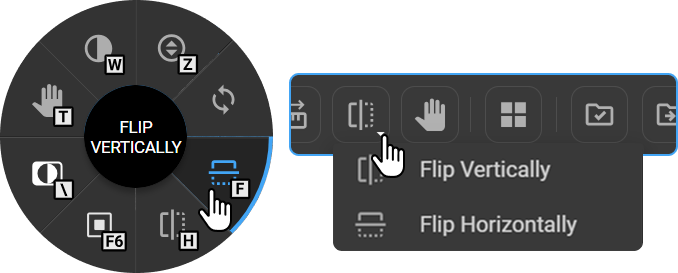
Hotkeys: H (Flip Horizontal) / F (Flip Vertical)
How to Use
- Select Flip Horizontal or Flip Vertical from the Image Control Wheel, Toolbar, or use the keyboard shortcut.
- The image immediately flips along the selected axis.
- Repeat the action to revert to the original orientation.
Markup Tools
Any measurement created using a Markup tool is automatically recorded in the Measurement Panel for review, editing, and reference.
1. Length Measurement
The Length Measurement tool calculates the straight-line distance between two user-defined points on the image. The measurement is displayed as a line with the distance value labeled alongside it in millimeters. The active measurement is displayed in green, while previously placed measurements appear in yellow. Multiple measurements can be placed simultaneously on the same image. It is one of the most commonly used measurement tools in diagnostic imaging, applied routinely to quantify lesion size, assess organ dimensions, evaluate anatomical relationships, and support clinical decision-making.
How to Access
- From the Image Control Wheel — right-click on the viewport and select Length, or add it via Customize Wheel if not already available.
- From the toolbar — add via Customize Toolbar, then click Length.
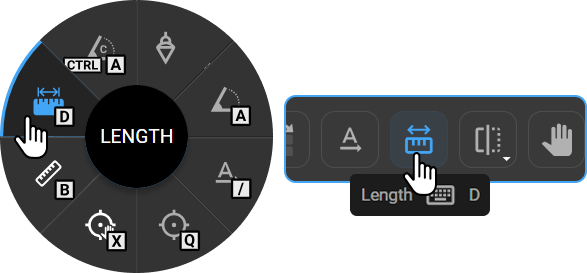
Hotkey: D
How to Use
- Select Length Measurement from the Image Control Wheel, Toolbar, or press D.
- Click to set the starting point.
- Move the cursor to the end location and click to complete the measurement.
- The measured distance is displayed on the image.
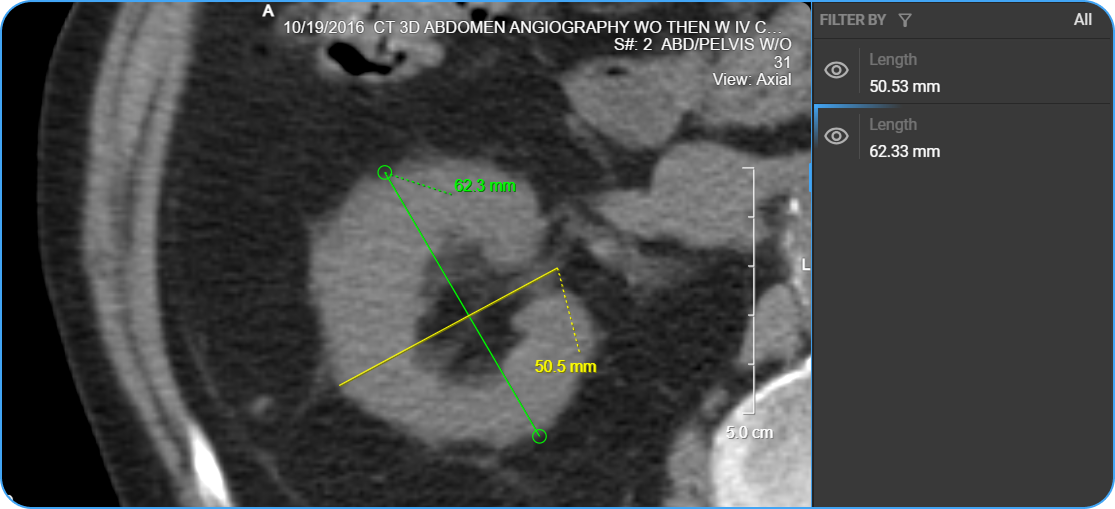
To adjust the measurement: Hover over the endpoints of the measurement line — circle handles appear at both endpoints. Click and drag either handle to reposition the line.
To reposition the label: Click and drag the measurement value to move it to a different location on the image.
2. Angle Measurement
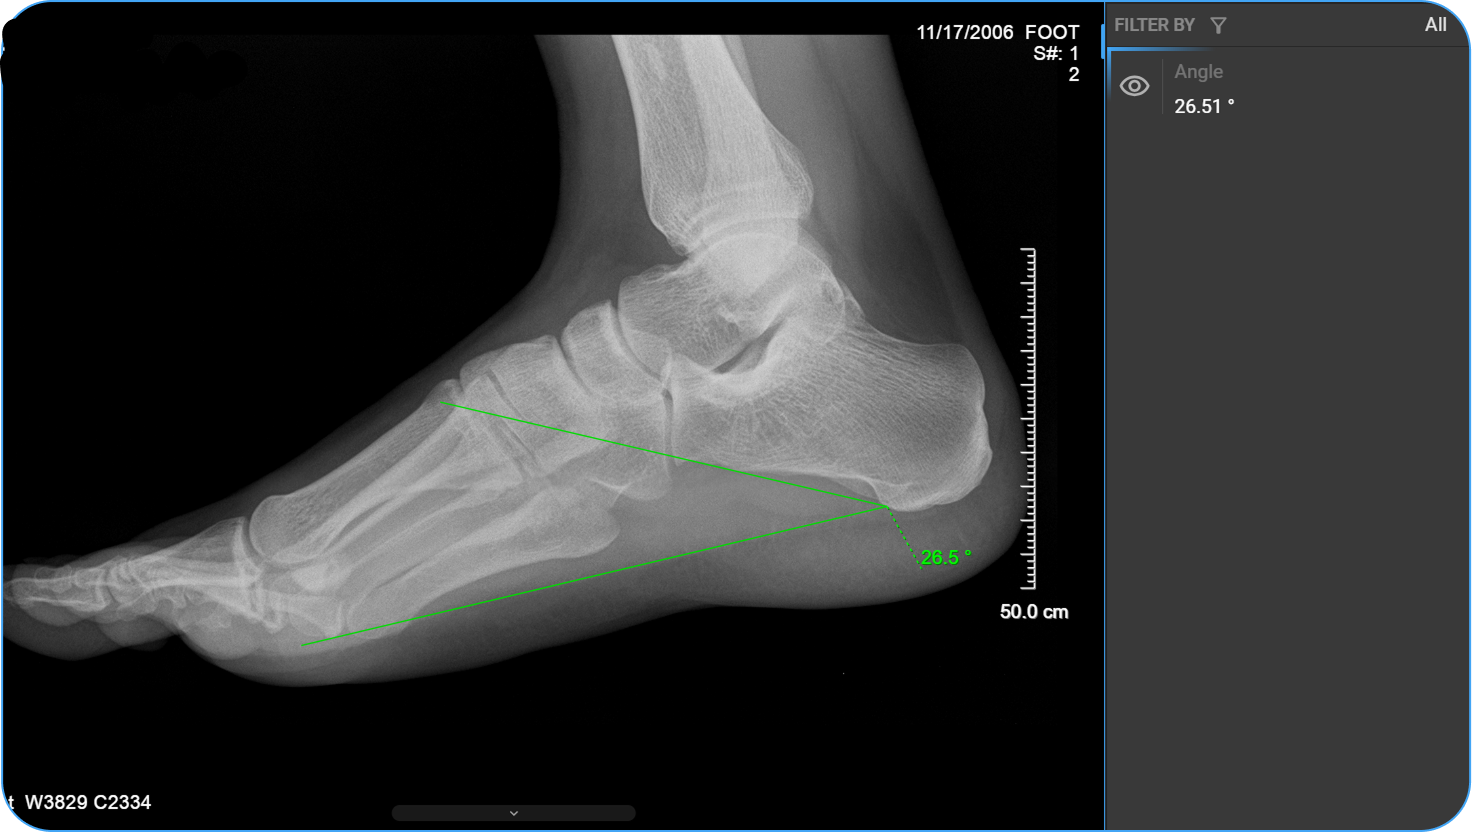
The Angle Measurement tool calculates the angle formed at the intersection of two lines placed on the image. It is widely used in musculoskeletal and orthopedic imaging to evaluate joint alignment, measure angular deformities, assess fracture angulation, and quantify anatomical positioning.
How to Access
- From the Image Control Wheel — right-click on the viewport and select Angle, or add it via Customize Wheel if not already available.
- From the toolbar — add via Customize Toolbar, then click Angle.
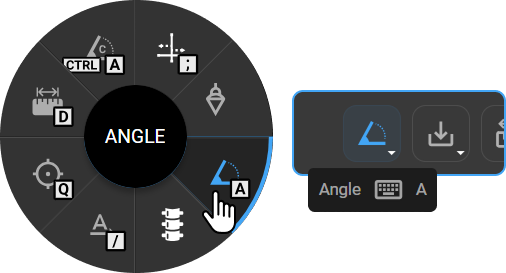
Hotkey: A
How to Use
- Select Angle Measurement from the Image Control Wheel, Toolbar, or press A.
- Click to place the first point.
- Click to place the vertex point where the angle will form.
- Click to place the third point, completing the angle.
- The angle value is displayed in degrees at the vertex.
To adjust the measurement: Hover over any of the three points — the two outer endpoints or the central vertex — to reveal the circle handles. Click and drag any handle to modify the angle. The measurement value updates automatically.
To reposition the label: Click and drag the label to move it to a different location on the image.
3. Plumb Line
The Plumb Line tool places a vertical reference line on the image to assess anatomical alignment and structural positioning. It is particularly valuable in spinal imaging for evaluating coronal and sagittal balance, identifying midline deviation, and assessing the structural symmetry of the spine relative to a plumb reference.
How to Access
- From the Image Control Wheel — right-click on the viewport and select Plumb Line, or add it via Customize Wheel if not already available.
- From the toolbar — add via Customize Toolbar, then click Plumb Line.
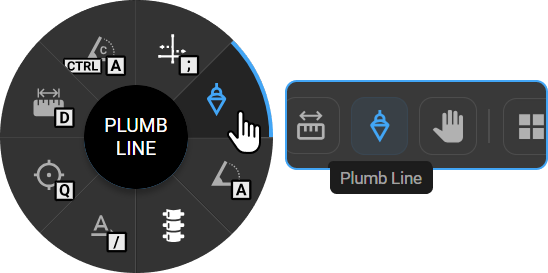
Hotkey: —
How to Use
- Select Plumb Line from the Image Control Wheel or Toolbar.
- Click on the image to place the vertical reference line.
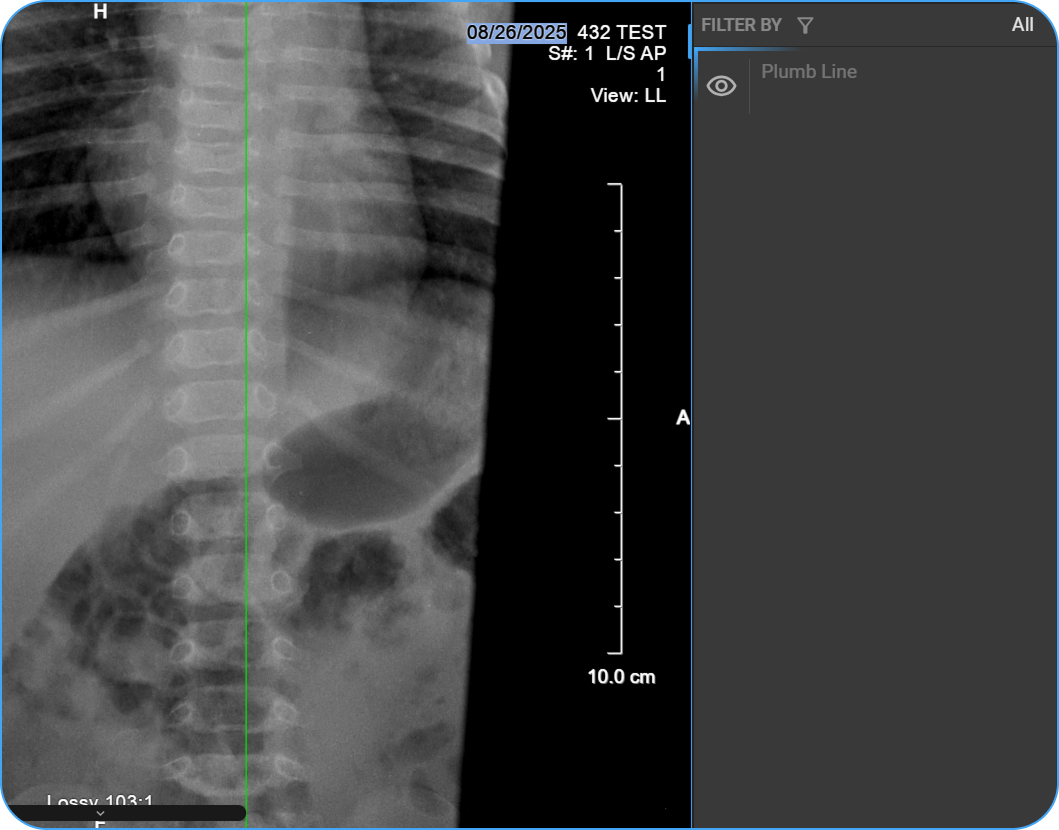
To adjust the measurement: Click and drag the Plumb Line to reposition it as needed.
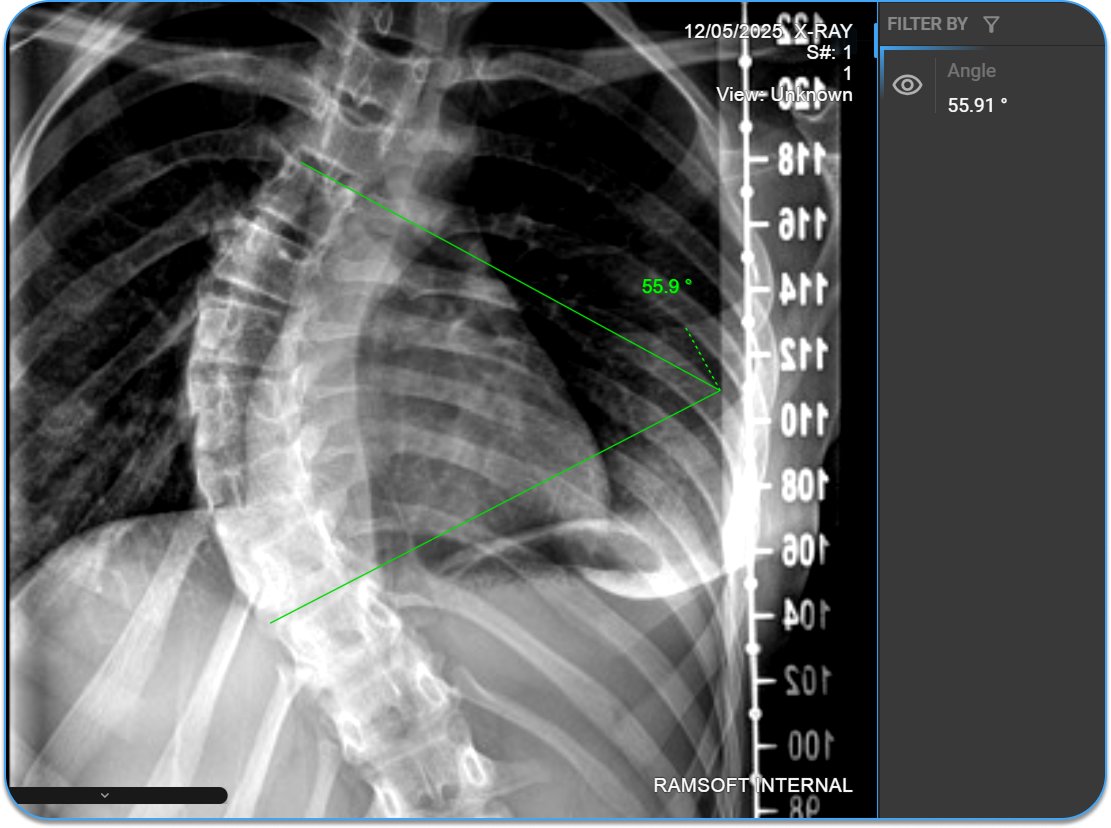
4. Cobb's Angle
The Cobb's Angle tool is the gold standard for quantifying spinal curvature on radiographic images. It measures the degree of spinal deformity — such as scoliosis — by calculating the angle between a line drawn along the superior endplate of the uppermost tilted vertebra and a line drawn along the inferior endplate of the lowermost tilted vertebra of the curve. The resulting angle represents the severity of curvature and is used to diagnose and grade scoliosis, determine treatment thresholds, and monitor deformity progression over time. OmegaAI calculates the angle automatically once both lines are placed.
How to Access
- From the Image Control Wheel — right-click on the viewport and select Cobb's Angle, or add it via Customize Wheel if not already available.
- From the toolbar — add via Customize Toolbar, then click Cobb's Angle.
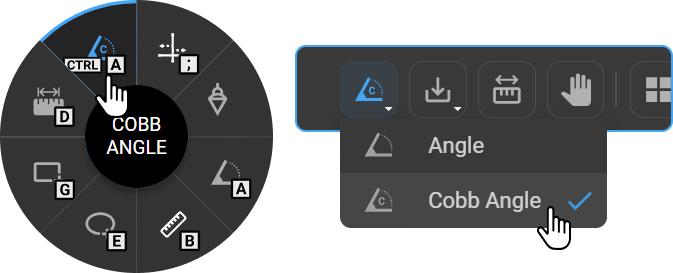
Hotkey: Ctrl+A
How to Use
- Select Cobb's Angle from the Image Control Wheel, Toolbar, or press Ctrl+A.
- Click to place the first line along the superior endplate of the upper vertebra.
- Click to place the second line along the inferior endplate of the lower vertebra.
- The Cobb's Angle is automatically calculated and displayed.
To adjust: Hover over either line — circle handles appear at both endpoints. Click and drag to reposition. The angle value updates automatically.
To reposition the label: Click and drag the label to move it to a different location on the image.
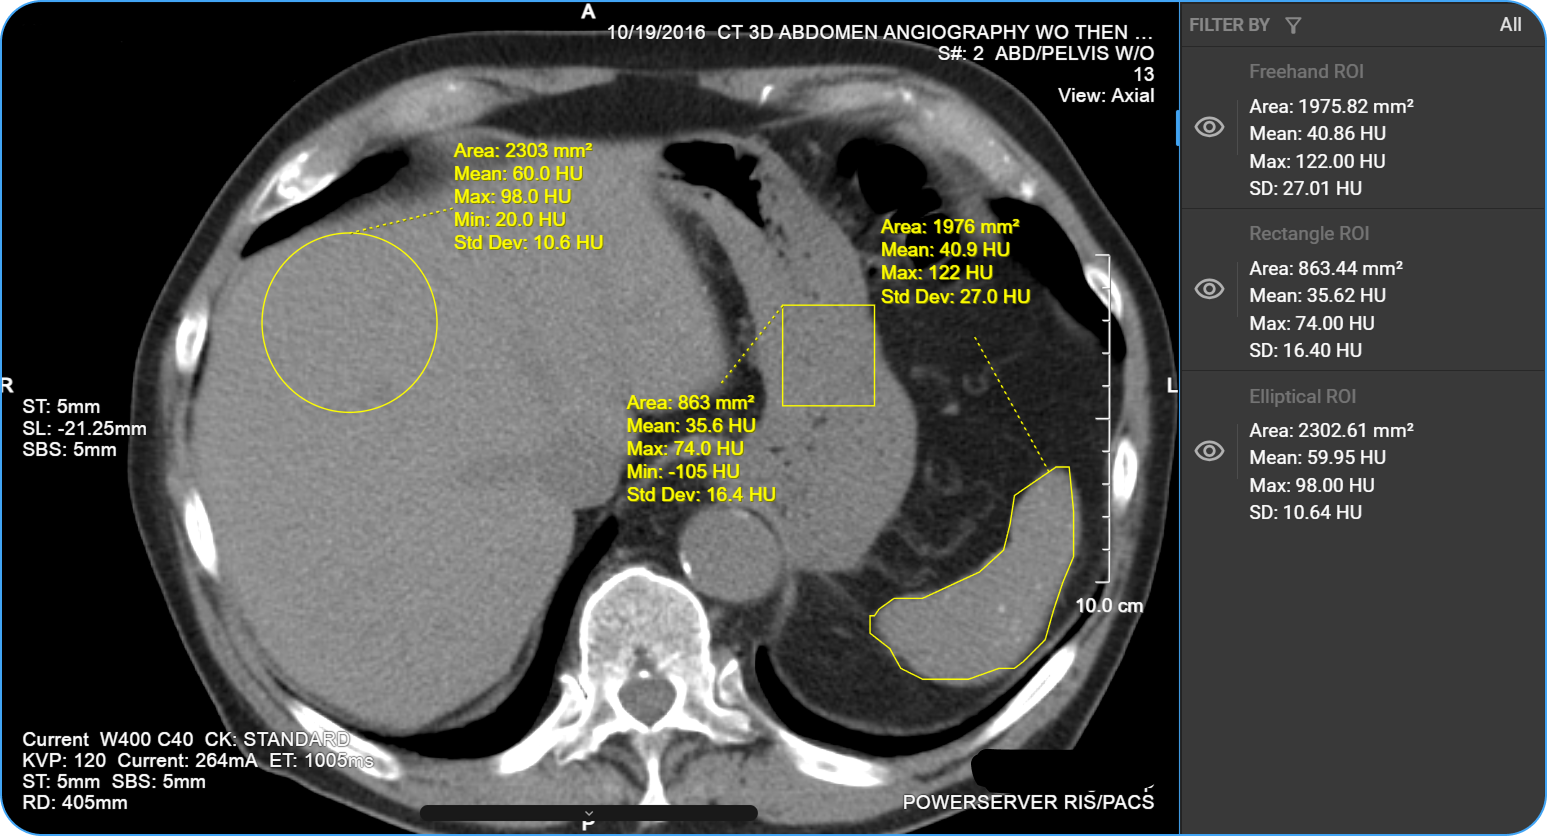
5. ROI (Rectangular, Elliptical, Freehand, Circle)
The ROI tools define a Region of Interest on the image for quantitative tissue analysis. Four shapes are available to accommodate different anatomical boundaries and clinical needs. Once drawn, the system automatically calculates density statistics within the defined region and displays them alongside the ROI boundary — supporting lesion characterization, tissue comparison, and quality assessment workflows.
How to Access
- From the Image Control Wheel — right-click on the viewport and select ROI, or add it via Customize Wheel if not already available.
- From the toolbar — add via Customize Toolbar, then click the ROI icon and select the desired shape from the dropdown.
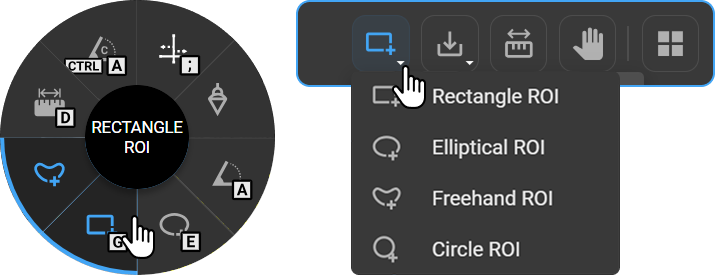
Hotkeys: G (Rectangle ROI) / E (Elliptical ROI) / — (Freehand ROI) / — (Circle ROI)
Displayed Statistics
The following values are calculated and displayed alongside the ROI boundary upon completion. Radius applies to Circle ROI only.
| Value | Description |
|---|---|
| Radius (Circle ROI only) | Radius of the circle in mm |
| Area | Total area of the ROI |
| Mean HU | Average Hounsfield Unit value within the region |
| Max HU | Highest HU value within the region |
| Min HU | Lowest HU value within the region |
| Standard Deviation (Rectangle, Elliptical, Freehand only) | Spread of HU values within the ROI |
How to Use
Rectangle ROI
- Select Rectangle ROI from the Toolbar dropdown or press G.
- Click and drag diagonally on the image to draw a rectangular region.
- Release the mouse to complete.
To adjust: Hover over the boundary — circle handles appear at the corners and edges. Drag a handle to resize. Click and drag the boundary to move the ROI.
Elliptical ROI
- Select Elliptical ROI from the Toolbar dropdown or press E.
- Click and drag on the image to draw an elliptical region.
- Release the mouse to complete.
To adjust: Hover over the boundary — circle handles appear along the edges. Drag a handle to resize or reshape. Click and drag the boundary to move the ROI.
Freehand ROI
- Select Freehand ROI from the Toolbar dropdown.
- Click and drag to draw a custom boundary around the desired region.
- Release the mouse to close and complete the ROI.
To adjust: Click on the boundary and drag to redraw the freehand region.
Circle ROI
- Select Circle ROI from the Toolbar dropdown.
- Click to set the center point, then drag outward to define the radius.
- Release the mouse to complete.
To adjust: Hover over any of the four sides of the circle to reveal a circular handle — drag to resize. Click and drag the circle handle in the center or boundary to move the ROI.
To reposition the label: Click and drag the label to move it to a different location on the image.
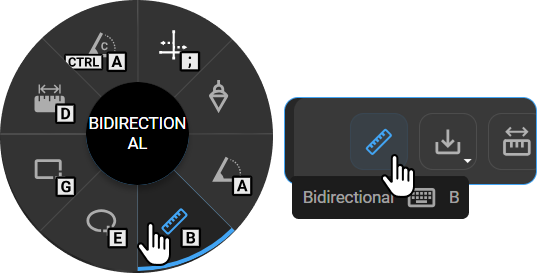
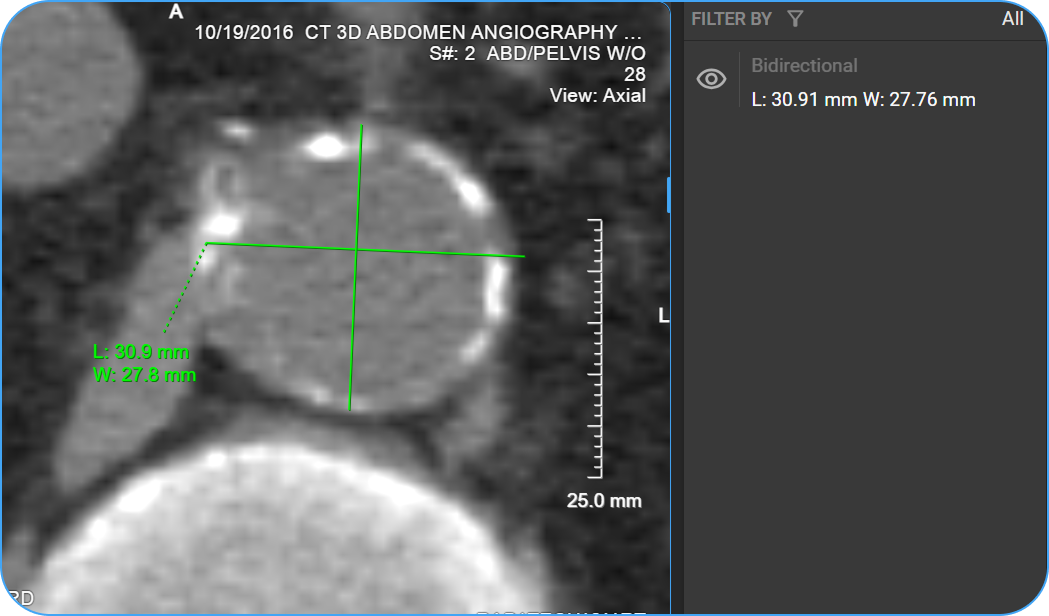
6. Bidirectional Tool
The Bidirectional tool places two perpendicular measurement lines on the image simultaneously, capturing both the longest diameter (L) and the perpendicular short-axis diameter (W) of a structure in a single annotation. Both values are displayed directly on the image and automatically recorded in the Measurement Panel. It is widely used in oncology and radiology for lesion sizing according to response evaluation criteria such as RECIST, where two-dimensional measurements are required.
How to Access
- From the Image Control Wheel — right-click on the viewport and select Bidirectional, or add it via Customize Wheel if not already available.
- From the toolbar — add via Customize Toolbar, then click Bidirectional.
Hotkey: B
How to Use
- Select Bidirectional Tool from the Image Control Wheel, Toolbar, or press B.
- Click to place the first point of the primary line.
- Click to place the second point, completing the primary measurement.
- A perpendicular line appears automatically — drag it to the desired position and click to set.
To adjust: Hover over the lines to reveal circle handles at the endpoints. Drag any handle to adjust the length, width, or orientation.
To reposition the label: Click and drag the label to move it to a different location on the image.
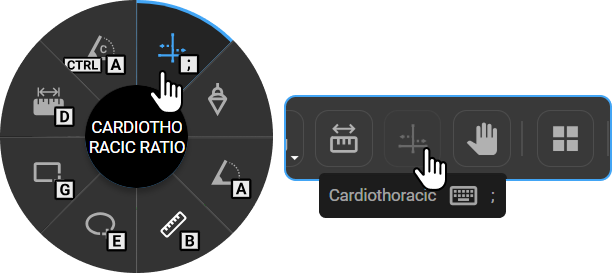
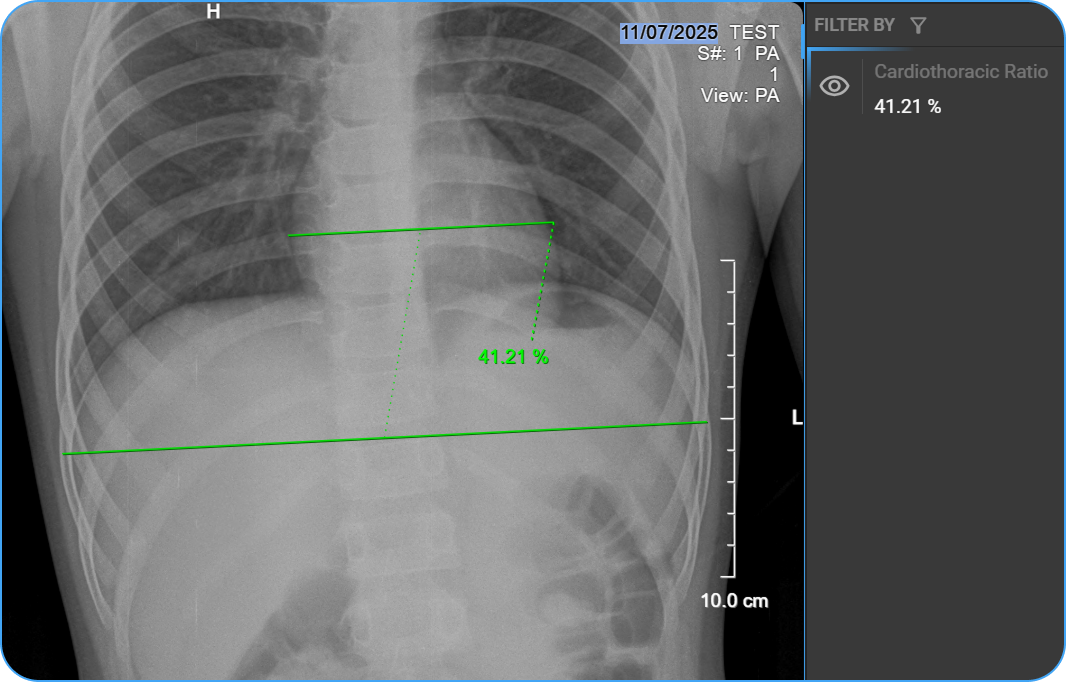
7. Cardiothoracic Ratio
The Cardiothoracic Ratio (CTR) tool measures the ratio of the maximum transverse cardiac diameter to the maximum transverse thoracic diameter on a chest radiograph. Two horizontal measurement lines are placed on the image — one spanning the widest point of the heart and one spanning the widest internal diameter of the thoracic cage. The CTR percentage is calculated automatically and displayed both on the image and in the Measurement Panel. A CTR greater than 0.5 (50%) is generally considered indicative of cardiomegaly.
How to Access
- From the Image Control Wheel — right-click on the viewport and select Cardiothoracic, or add it via Customize Wheel if not already available.
- From the toolbar — add via Customize Toolbar, then click Cardiothoracic.
Hotkey: ;
How to Use
- Select Cardiothoracic Ratio from the Image Control Wheel, Toolbar, or press ;.
- Click once on the image — two horizontal lines appear, one for the cardiac width and one for the thoracic width.
- Adjust each line to align with the widest points of the heart and thorax.
To adjust the measurement: Click on the line and drag to reposition it. Hover over the endpoints to reveal circle handles — drag a handle to resize the line. The CTR percentage updates automatically.
To reposition the label: Click and drag the label to move it to a different location on the image.
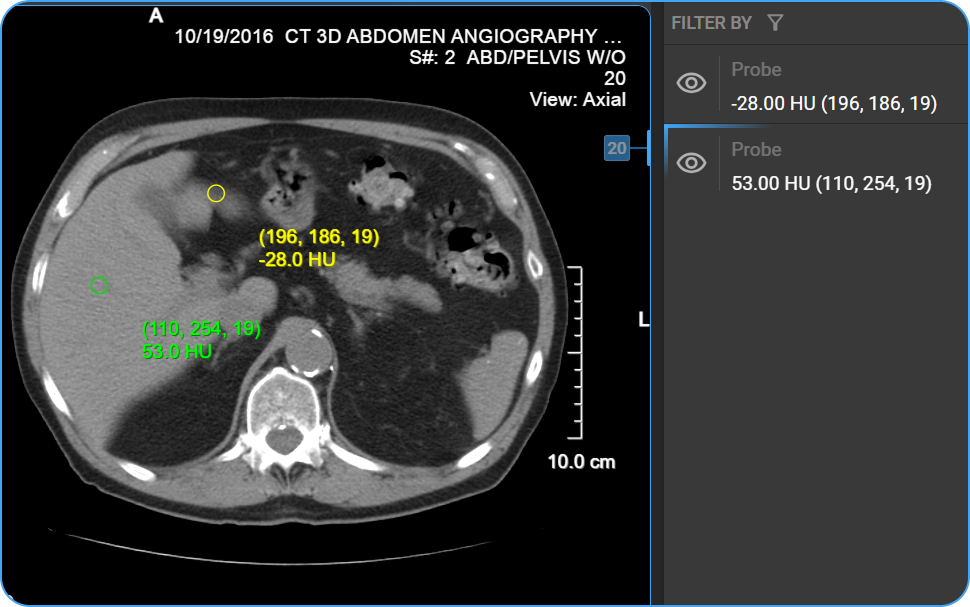
8. Probe
The Probe tool places a point marker on the image and displays the pixel intensity value at that precise location. In CT imaging, this is expressed as a Hounsfield Unit (HU) value, which reflects tissue density and is used to characterize structures such as cysts, nodules, fat, and effusions. The coordinates of the probe point are also displayed for spatial reference. Multiple probes can be placed simultaneously — the active probe is displayed in yellow and previously placed probes appear in green. All probe values are automatically recorded in the Measurement Panel.
In PET-CT Fusion Mode, the Probe tool additionally enables volumetric Standardized Uptake Value (SUV) measurements directly on the fused image, without requiring a manually drawn ROI contour.
How to Access
- From the Image Control Wheel — right-click on the viewport and select Probe, or add it via Customize Wheel if not already available.
- From the toolbar — add via Customize Toolbar, then click Probe.
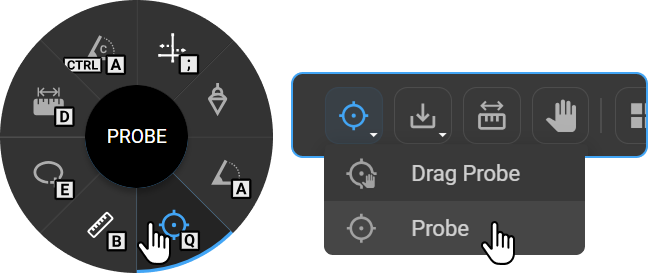
Hotkey: Q
How to Use
- Select Probe from the Image Control Wheel, Toolbar, or press Q.
- Click anywhere on the image to place the probe marker.
- The following values are displayed next to the marker:
- Coordinates (X, Y, Slice)
- HU value (for CT images)
To adjust the measurement: Click and drag the probe marker (yellow circle) to reposition it. The displayed values update automatically.
To reposition the label: Click and drag the label to move it to a different location on the image.
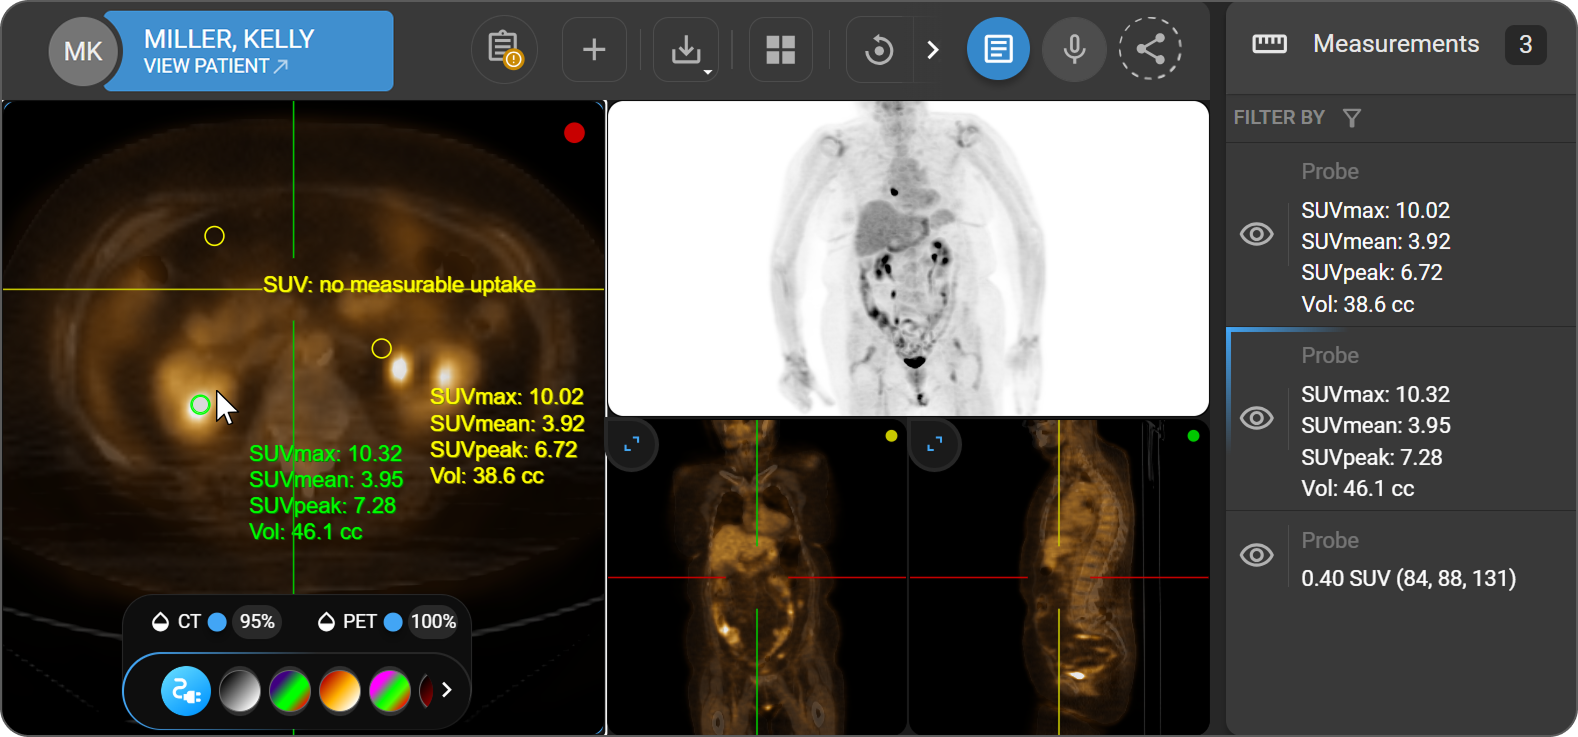
SUV Measurement (PET-CT Fusion Mode)
When a probe is placed on a region of increased FDG uptake in Fusion Mode, OmegaAI automatically computes volumetric SUV metrics. The system segments the uptake region and calculates the full suite of SUV values based on the automatically defined volume — no manual ROI contour is required.
Depending on the area selected, the probe returns one of two results:
- Measurable uptake — SUV metrics are displayed on the image overlay next to the probe marker and recorded in the Measurement Panel.
- No measurable uptake — The label "SUV: no measurable uptake" is shown, indicating a background or low-uptake region.
Displayed SUV Metrics
| Metric | Description |
|---|---|
| SUVmax | Highest SUV value recorded within the segmented region |
| SUVmean | Arithmetic mean of SUV values across all voxels in the region |
| SUVpeak | Mean SUV value within a 1 cm³ sphere centered on the SUVmax voxel |
| Vol (cc) | Total lesion volume, calculated as voxel count × voxel spacing |
Multiple probes can be placed simultaneously within the same study. Placed markers can be repositioned at any time by clicking and dragging — SUV values update automatically.
To learn more, see PET-CT Fusion Mode.
9. Drag Probe
The Drag Probe displays pixel information dynamically as the cursor moves across the image, without placing a permanent marker. It is useful for quick checks of Hounsfield Unit (HU) values or pixel intensity during image review without leaving annotations on the image.
How to Access
- From the Image Control Wheel — right-click on the viewport and select Drag Probe, or add it via Customize Wheel if not already available.
- From the toolbar — add via Customize Toolbar, then click Drag Probe.
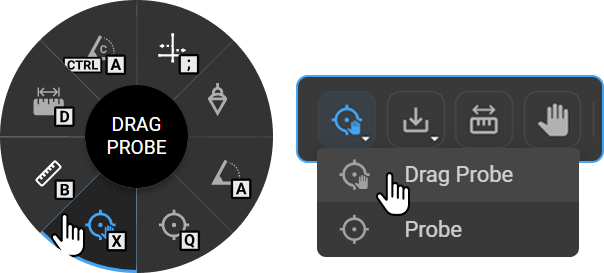
Hotkey: X
How to Use
- Select Drag Probe from the Image Control Wheel, Toolbar, or press X.
- Click and drag the cursor across the image.
- The HU value and coordinates update continuously as you move the cursor.
- Release the mouse to stop — no marker is left on the image.
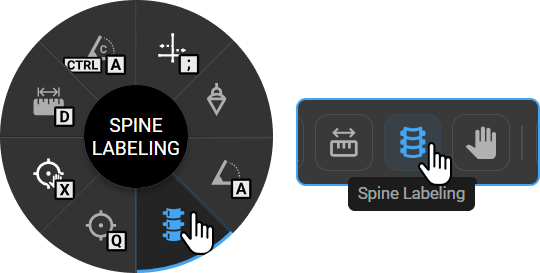
10. Spine Labelling
The Spine Labelling tool places vertebral level identifiers directly on spinal images, providing clear anatomical reference markers for reporting and communication. Labels are placed by clicking the superior and inferior endplates of each vertebra in sequence, and the system auto-increments the label designation as you progress through the spine. The active label is displayed in green, while previously placed labels appear in yellow.
How to Access
- From the Image Control Wheel — right-click on the viewport and select Spine Labeling, or add it via Customize Wheel if not already available.
- From the toolbar — add via Customize Toolbar, then click Spine Labeling.
Hotkey: —
How to Use
- Select Spine Labelling from the Image Control Wheel or Toolbar. The Spine Labelling dialog appears.
- Select the starting vertebra from the Vertebrae dropdown (e.g., C1, T1, L1).
- Select the labelling direction using the Direction toggle:
- ↑ — Label vertebrae in the upward direction
- ↓ — Label vertebrae in the downward direction
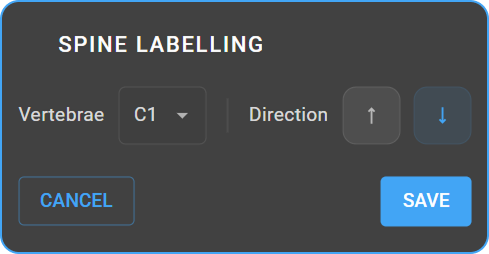
- Click Save to begin labelling, or Cancel to exit.
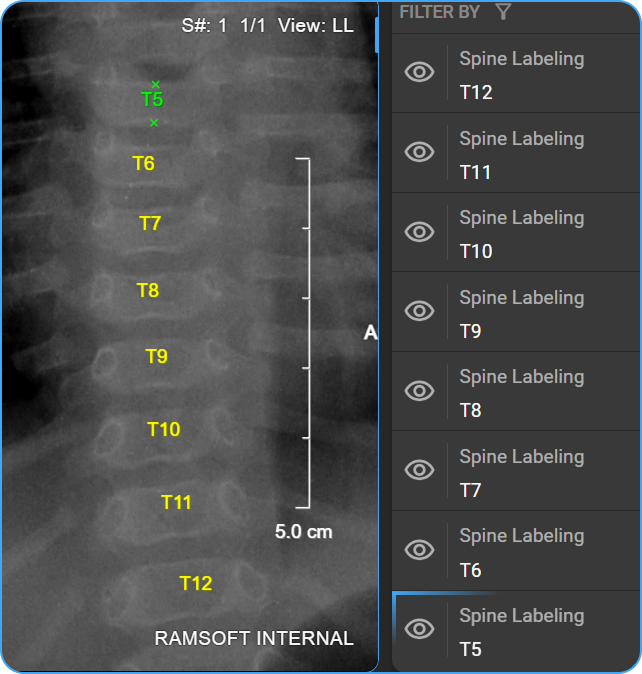
Placing Labels
- Click the upper endplate of the vertebra — a green X mark appears.
- Click the lower endplate — a second green X mark appears.
- The vertebra label (e.g., T5) is automatically placed between the two marks.
- Continue clicking the endplates of subsequent vertebrae — labels auto-increment (T6, T7, T8…).
- Click and drag any label to reposition it.
11. Annotate
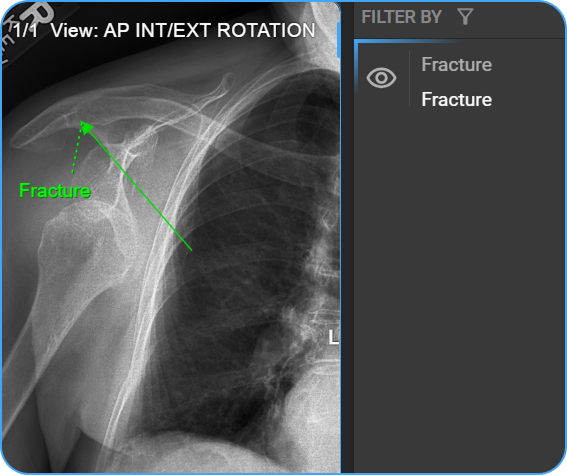
The Annotate tool places a directional arrow with an optional text label on the image, enabling users to mark and describe specific findings. The arrow points to the area of interest, and the text label appears adjacent to the arrowhead — connected by a dashed line that allows the label to be repositioned independently. The tool is commonly used to identify areas of pathology, guide referring physicians to key findings, document observations for follow-up, and prepare annotated images for reports or educational presentations.
How to Access
- From the Image Control Wheel — right-click on the viewport and select Annotate, or add it via Customize Wheel if not already available.
- From the toolbar — add via Customize Toolbar, then click Annotate.
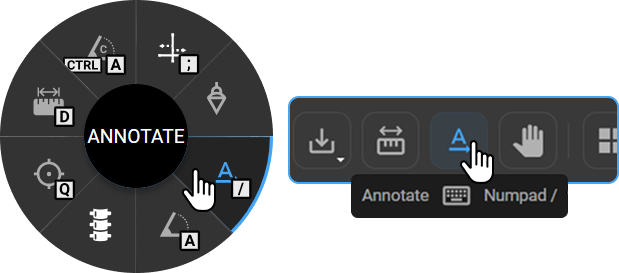
Hotkey: / (Numpad)
How to Use
- Select Annotate from the Image Control Wheel, Toolbar, or press / on the Numpad.
- Click on the image to place an arrow.
- Drag to set the arrow's direction and length.
- A text box appears — type to label the finding, or leave it empty if only an arrow is needed.
To adjust: Hover over the arrow to reveal circle handles. Drag the handles to change the arrow's position, angle, or length.
To reposition the label: Click and drag the label to move it to a different location on the image.
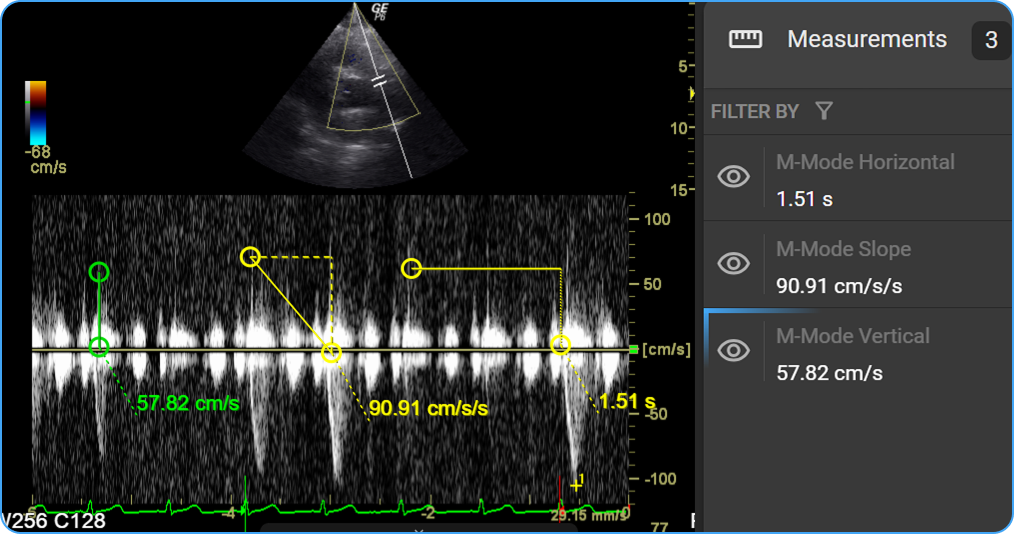
12. M-Mode
The M-Mode (Motion Mode) tool is a specialized measurement tool for ultrasound imaging that captures the motion of cardiac structures along a single scan line over time. The result is a time-motion graph where the horizontal axis represents time, and the vertical axis represents depth from the transducer. Clinicians use M-Mode to assess cardiac wall motion, valve function, chamber dimensions, and the timing of cardiac events within the cardiac cycle.
M-Mode series are automatically detected when an ultrasound study is loaded in the Image Viewer. When an M-Mode series is active in a viewport, the M-Mode measurement tools become available automatically — no manual activation is required. Non-M-Mode ultrasound series do not trigger these tools.
How to Access
|
|

The M-Mode tool is only available when an M-Mode ultrasound series is active in the viewport.
Hotkey: —
How to Use
Once an M-Mode series is loaded and active in the viewport, three dedicated measurement tools become available in the toolbar. All three tools follow the same interaction pattern: click and drag to place the measurement, click and drag the line to reposition it, or hover over either endpoint and drag to resize it. Results update automatically after any adjustment.
Slope Measurement
Calculates the velocity of a cardiac structure's motion by drawing a diagonal line across its trace. It measures the rate of displacement along the scan line over time, making it useful for evaluating the motion of structures such as the mitral valve leaflet, interventricular septum, or posterior wall. Once placed, dashed reference lines appear along the horizontal and vertical axes to indicate the time and velocity components of the slope. Results are expressed in cm/s.
- Select Slope Measurement from the toolbar.
- Click and drag across the motion trace — OmegaAI draws a diagonal line and displays the result in cm/s adjacent to the line.
Horizontal Measurement
Measures the time interval between two points along the horizontal (time) axis. It is used to quantify the duration of cardiac cycle phases — including systole, diastole, or the interval between specific cardiac events — and supports calculations such as heart rate and cycle regularity. Results are expressed in seconds (s).
- Select Horizontal Measurement from the toolbar.
- Click and drag along the time axis — OmegaAI draws a horizontal line and displays the result in seconds (s) adjacent to the line.
Vertical Measurement
Measures the distance between two points along the vertical axis. In Doppler mode, the vertical axis represents flow velocity, so the result reflects the velocity span between the two selected points — useful for quantifying peak flow velocities and velocity differences across cardiac structures. Results are expressed in cm/s.
- Select Vertical Measurement from the toolbar.
- Click and drag along the vertical axis — OmegaAI draws a vertical line and displays the result in cm/s adjacent to the line.
All measurements are calibrated to the DICOM metadata of the ultrasound image using the physical delta values from the ultrasound region data. Measurement results are saved as annotations and are available for structured reporting.