Customize Overlay Annotations
Overview
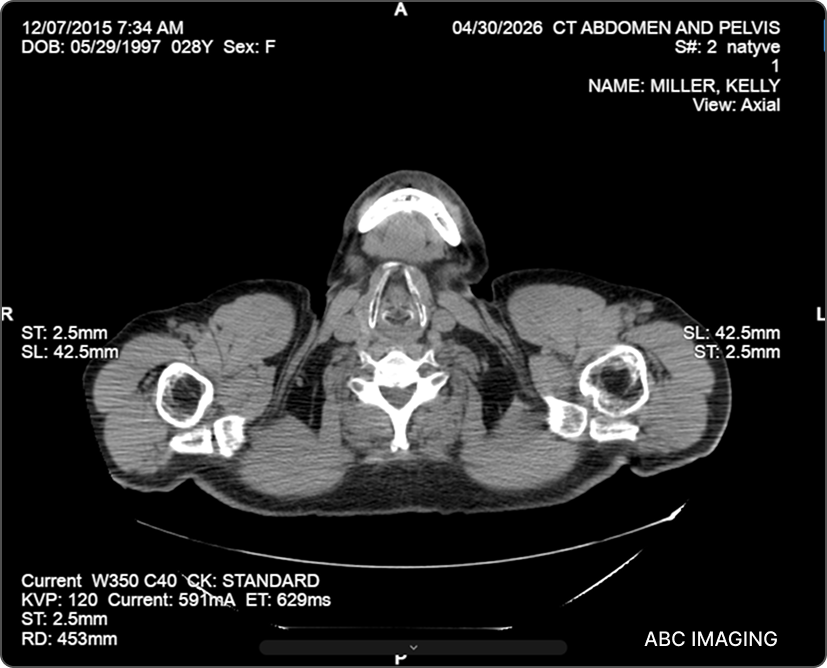
Overlay annotations in OmegaAI display contextual information directly on image viewports during review — including patient demographics, study metadata, acquisition parameters, and DICOM values. The Customize Overlay feature gives users full control over what information is displayed, where it appears on the viewport, and how it is formatted.
Accessing Overlay Customization
- Open a study in the Image Viewer.
- Click More Options (⋯) in the top toolbar.
- Select Settings → Customize Overlays.
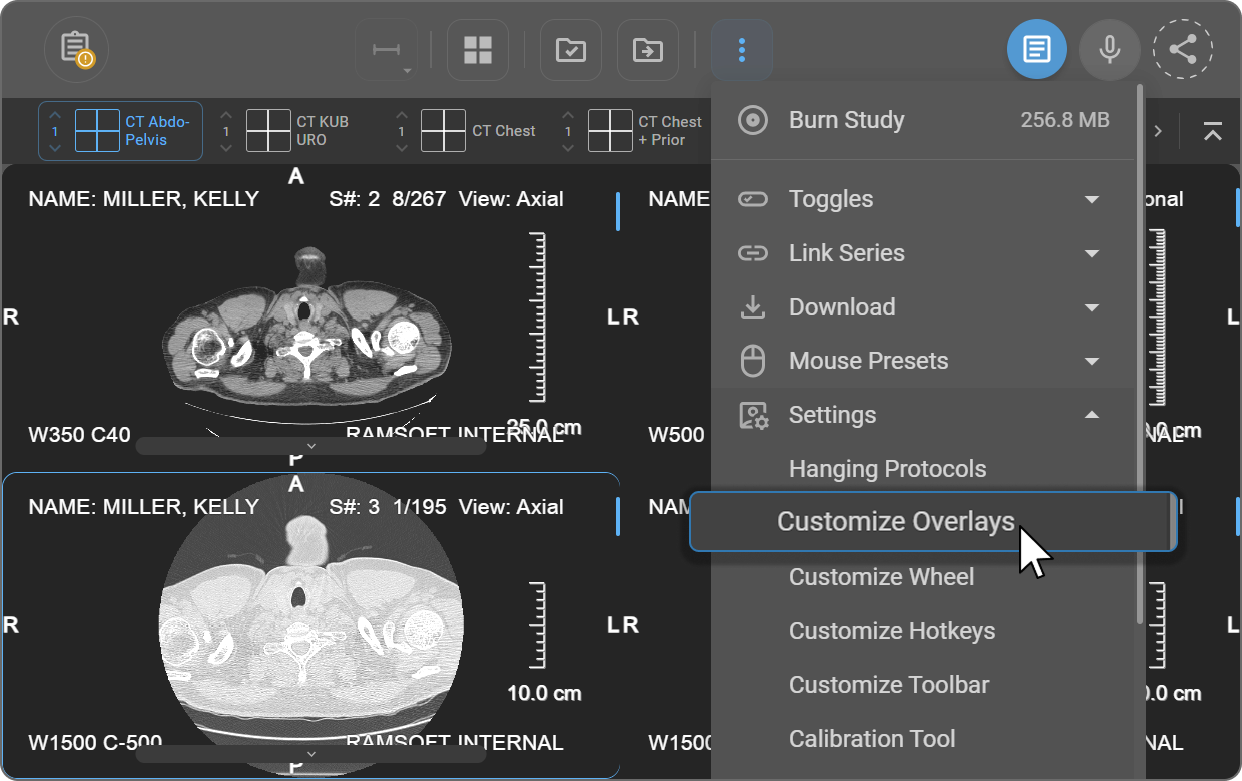
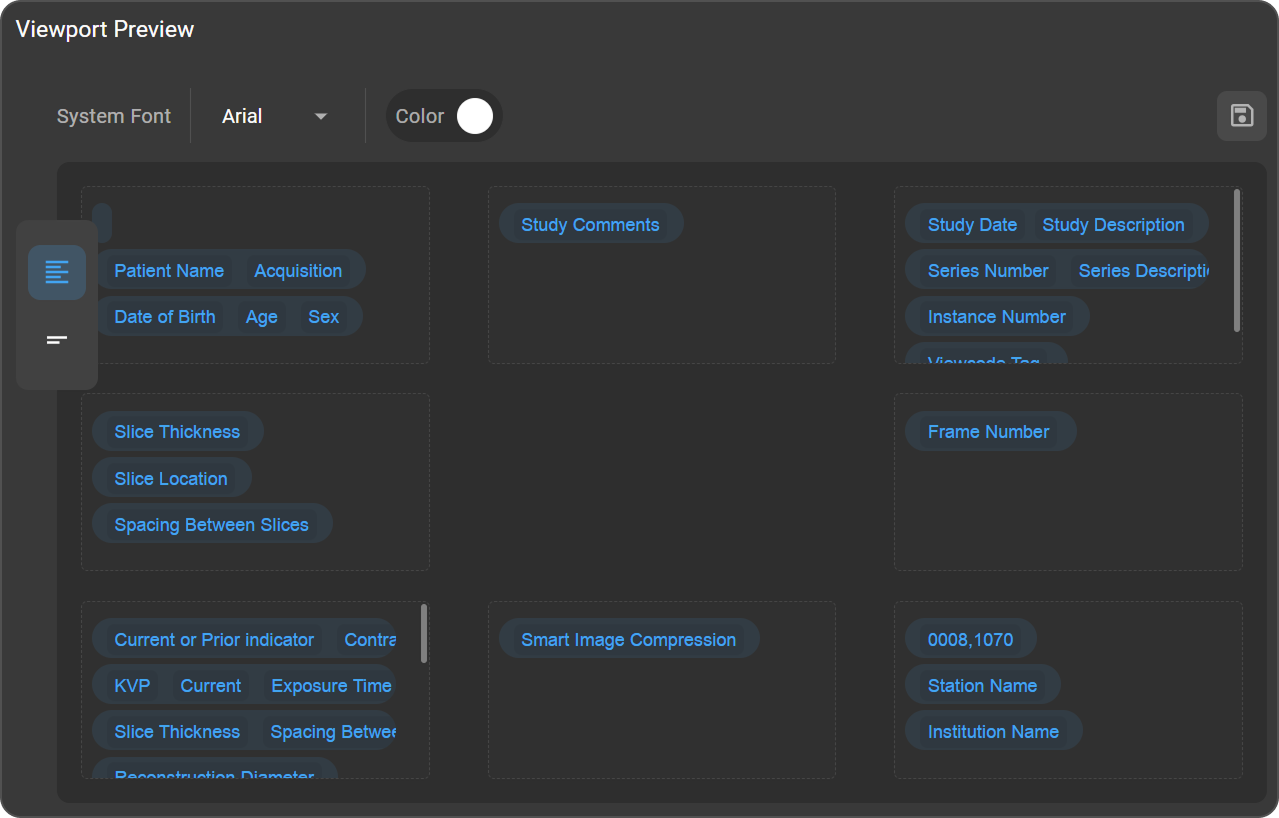
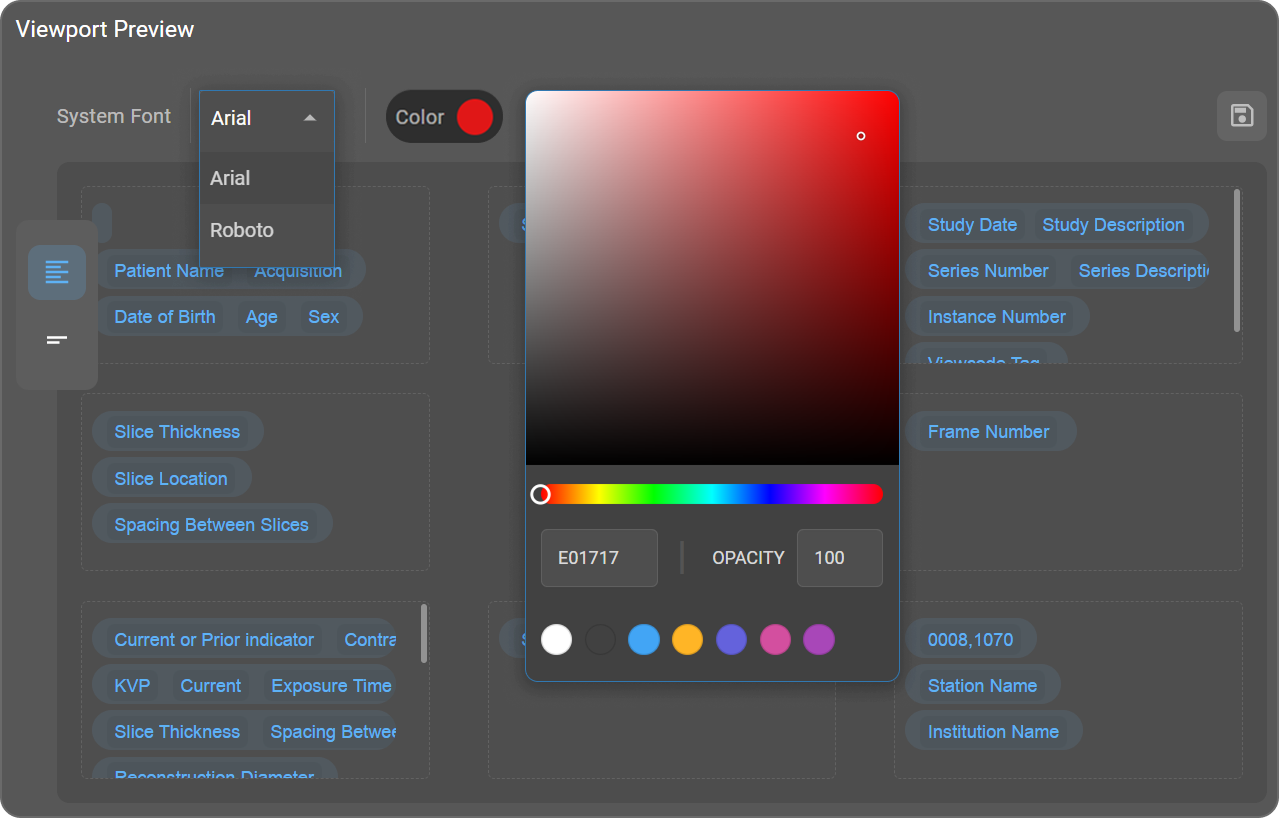
The Viewport Preview screen opens, displaying all eight overlay positions mapped to the viewport layout.
Viewport Overlay Positions
Each viewport supports overlay annotations at eight positions. The layout mirrors the viewport itself:
| Top Left | Top | Top Right |
|---|---|---|
| Left | (image area) | Right |
| Bottom Left | Bottom | Bottom Right |
Click any position within the Viewport Preview to edit its content. For each position, you can:
- Add free text
- Select from predefined DICOM annotations
- Remove existing annotations
Overlay Tiers
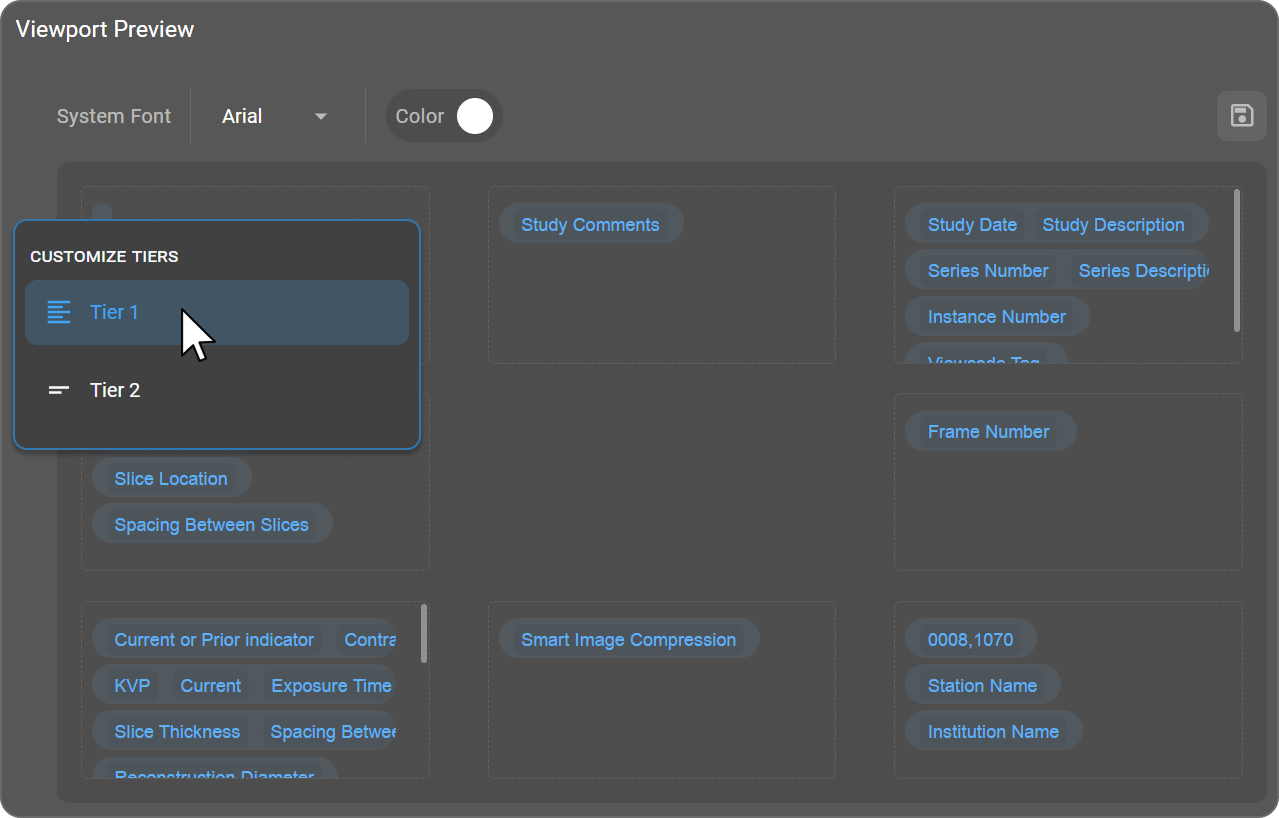
OmegaAI uses two overlay tiers to balance information density with readability based on viewport size. Hover over the tier icon on the left side of the Viewport Preview to open the Customize Tiers panel — select Tier 1 or Tier 2. The active tier is highlighted in blue.
Tier 1 — Detailed
Tier 1 is applied when the viewport is larger than 500 pixels. It displays a comprehensive set of DICOM information — including patient details, study and series metadata, and acquisition parameters — intended for detailed clinical review, QA workflows, and scenarios requiring full contextual data.
Tier 2 — Minimal
Tier 2 is applied when the viewport is smaller than 500 pixels. It shows only essential DICOM information, keeping overlays readable without obstructing the image. This tier is suited to split-view layouts, smaller screens, quick reviews, and presentations.
Automatic adjustment: OmegaAI automatically switches to Tier 2 when a viewport drops below 500 pixels, and restores Tier 1 when it is resized above 500 pixels.
Font and Color
Both settings are located at the top of the Viewport Preview screen and apply uniformly to all overlay annotations across all viewports.
Font Click the dropdown next to System Font to select a typeface. Two options are available: Arial or Roboto.
Color Click the Color swatch to open the color picker.
| Control | Description |
|---|---|
| Gradient canvas | Click or drag to select the precise shade of the chosen hue |
| Hue slider | Drag the circular handle to select the base color |
| Hex value field | Enter a specific color code directly (e.g., FFFFFF for white) |
| Opacity | Set a value from 0 to 100 to control annotation transparency |
| Preset swatches | Click any swatch for quick color selection |
The selected color is applied to all overlay annotations across all viewports.
Adding DICOM Tags
- Click inside the desired position area in the Viewport Preview.
- Type # to open the tag search — the prompt "Type # to insert overlay tag" confirms the field is active.
- Continue typing to filter results — matching tag names and DICOM tag numbers appear in a dropdown as you type (e.g., typing #pa displays Patient Name, Patient ID, and other matching tags).
- Click the required tag from the dropdown to insert it.
Localized Time Format
Time values in overlay annotations — including study date/time, series date/time, acquisition date/time, content date/time, and date of birth — automatically follow the user's browser locale. Locales that use a 12-hour clock display times as hh:mm AM/PM; locales that use a 24-hour clock display times as HH:mm. No manual configuration is required.
To change the time format, update your browser's language or region settings. The overlay annotations will reflect the updated locale on the next session.
- Chrome — Settings → Languages → Reorder or add a preferred language.
- Firefox — Settings → General → Language → Choose your preferred language.
- Edge — Settings → Languages → Add or reorder preferred languages.
Formatted Annotation Reference
The following tables list all supported overlay annotations, their DICOM source tags, and the format in which the values are displayed on the image.
Standard Tags
| Annotation | DICOM Tag | Displayed Format |
|---|---|---|
| Window Center & Width | 0028,1050 + 0028,1051 | C + tag value - W + tag value — e.g. C150-W210 |
| Sharpness & Unsharp Mask Degree | 0016,004A + 310D,1020 | S + tag value - U: + tag value — e.g. S122-U444 |
| Convolution Kernel | 0018,1210 | CK: tag value |
| Acquisition Matrix | 0018,1310 | ACQ Matrix: tag value |
| Number of Averages | 0018,0083 | NEX: tag value |
| Echo Train Length | 0018,0091 | ETL: tag value |
| MR Acquisition Type | 0018,0023 | MAT: tag value |
| Sequence Name | 0018,0024 | SEQ: tag value |
| Sequence Variant | 0018,0021 | SV: tag value |
| Patient ID | 0010,0020 | PID: tag value |
| Date of Birth | 0010,0030 | DOB: tag value |
| Study ID | 0020,0010 | SID: tag value |
| Series Number | 0020,0011 | S#: tag value |
| Sex | 0010,0040 | Sex: tag value |
| Slice Thickness | 0018,0050 | ST: tag value mm |
| Spacing Between Slices | 0018,0088 | SBS: tag value mm |
| Contrast Agent | 0018,0010 | Trimmed to 30 characters |
| KVP | 0018,0060 | KVP: tag value |
| Exposure | 0018,1152 | Exp: tag value mAs |
| Exposure Time | 0018,1150 | ET: tag value ms |
| Compression Force | 0018,11A2 | CF: tag value N |
| Reconstruction Diameter | 0018,1100 | RD: tag value mm |
| Organ Dose | 0040,0316 | OD: tag value dGy (max 2 decimal places) |
| Positioner Primary Angle | 0018,1510 | PPA: tag value° (max 2 decimal places) |
| Body Part Thickness | 0018,11A0 | Thk: tag value mm (max 2 decimal places) |
| Repetition Time | 0018,0080 | TR: tag value ms (max 2 decimal places) |
| Echo Time | 0018,0081 | TE: tag value ms (max 2 decimal places) |
| Inversion Time | 0018,0082 | TI: tag value ms (max 2 decimal places) |
| Trigger Time | 0018,1060 | TD: tag value ms (max 2 decimal places) |
| Flip Angle | 0018,1314 | Flip: tag value° (max 2 decimal places) |
| Acquisition Matrix (alternate) | 0018,1310 | Matrix: tag value |
| Number of Averages (alternate) | 0018,0083 | Excite: tag value |
| Echo Train Length | 0018,0091 | ETL: tag value (max 2 decimal places) |
| Pixel Bandwidth | 0018,0095 | BW: tag value Hz (max 2 decimal places) |
Conditional Tags
Conditional tags derive their values from multiple DICOM fields, applying fallback logic when the primary field is absent.
| Annotation | Source Logic | Displayed Format |
|---|---|---|
| Age | 0010,1010 — if empty, calculated from date of birth (0010,0030) | If from tag: unformatted. If calculated: >2 years → e.g. 25Y; <2 years → e.g. 1Y 6M; <1 month → e.g. 25D |
| Instance Number | 0020,0013 divided by total frame count (0028,0008) | e.g. 25/125 |
| Slice Location | 0020,1041 → if absent: Table Position (0018,9327) → if absent: derived from Image Position Patient (0020,0032) | SL: tag value mm (max 2 decimal places) |
| Current or Prior Indicator | Displays Current for the opened study; Prior for other patient studies | Current or Prior |
Date / Time Tags
Displayed time format values follow the user's browser locale — see Localized Time Format.
| Annotation | Source Logic |
|---|---|
| Acquisition | 0008,002A → if absent: Acquisition Date (0008,0022) + Acquisition Time (0008,0032) → if absent: Content Date (0008,0023) + Content Time (0008,0033) |
| Study Date | Study Date (0008,0020) + Study Time (0008,0030) → if absent: Series Date (0008,0021) + Series Time (0008,0031) |
Unchanged Tags
The following tags are displayed exactly as stored in the DICOM file, without any additional formatting.
| Annotation | DICOM Tag |
|---|---|
| Study Comments | 0020,4000 |
| Study Description | 0008,1030 |
| Series Description | 0008,103E |
| Derivation Description | 0008,2111 |
| Technologist Name | 0008,1070 |
| Station Name | 0008,1010 |
| Institution Name | 0008,0080 |