PET-CT Fusion Mode
Overview
PET-CT Fusion Mode in OmegaAI combines Positron Emission Tomography (PET) and Computed Tomography (CT) imaging in a single viewing environment. A color-mapped PET image is overlaid onto the corresponding CT, enabling direct correlation of FDG (fluorodeoxyglucose) uptake with anatomical structures for comprehensive functional and morphological assessment.
The mode supports multi-planar review through synchronized MPR viewports and a Maximum Intensity Projection (MIP) view, with opacity sliders and a selectable PET color map for precise display control. For quantitative analysis, the integrated Probe tool calculates volumetric SUV metrics directly on the fused image — without requiring a manually drawn ROI contour — and all measurements persist across sessions.
PET-CT Fusion is particularly valuable for lesion localization, treatment planning, and diagnostic interpretation in oncologic imaging workflows.
Activating PET-CT Fusion Mode
Prerequisites
Before activating Fusion Mode, ensure the following conditions are met:
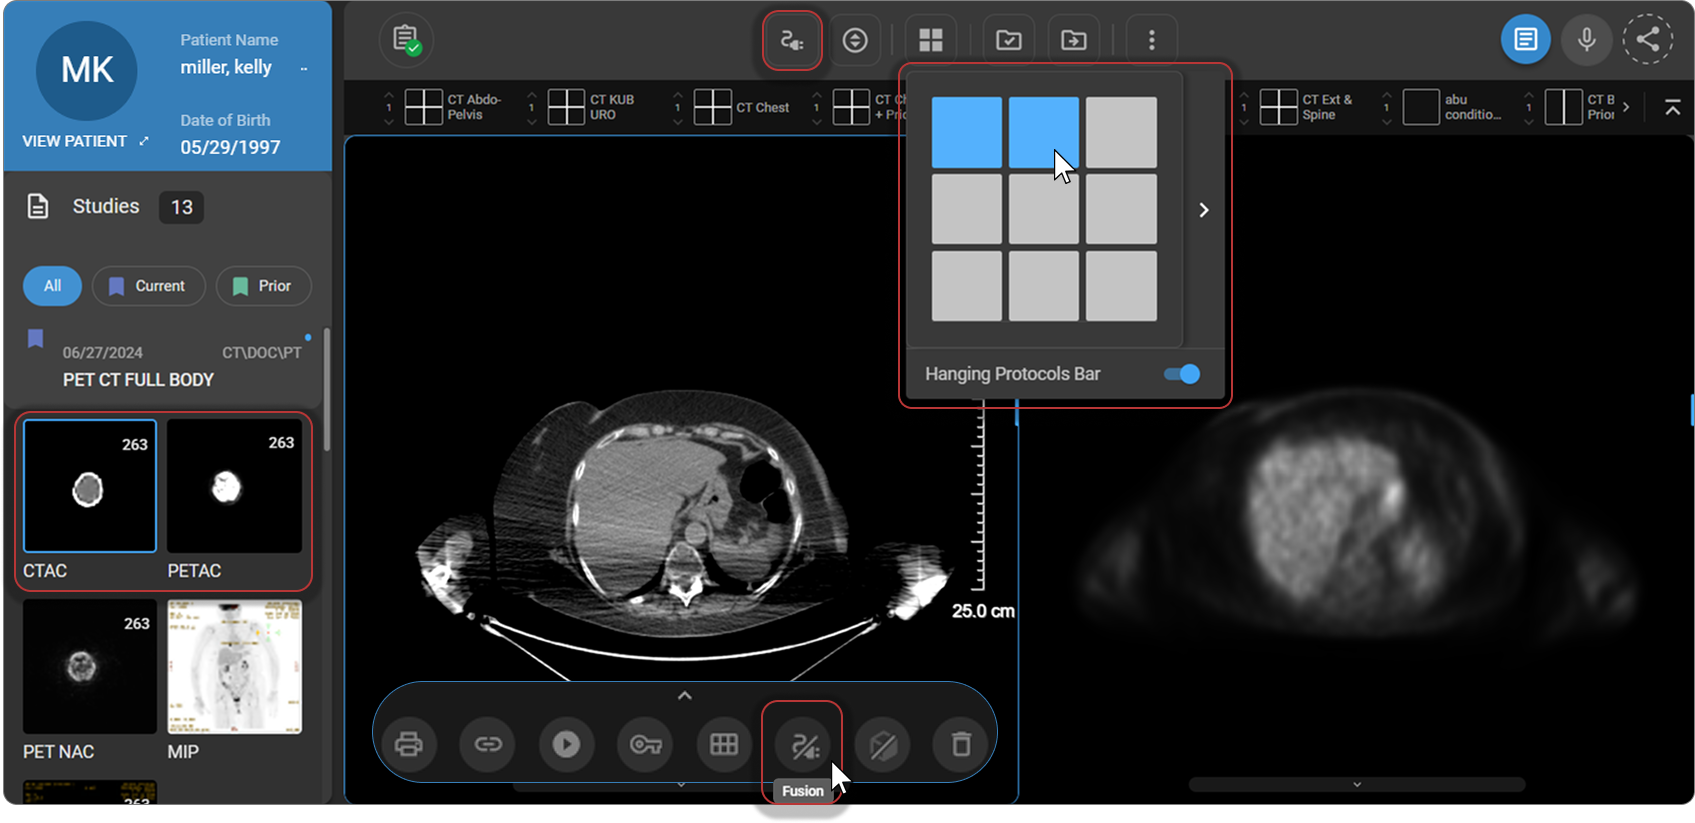
- The viewport layout is set to 1×2 (two viewports side by side). Use the Layout Selector in the toolbar to configure this if needed.
- One viewport contains the PET series and the other contains the corresponding CT series from the same study.
How to Access
- From the Viewport Menu — the Fusion button appears at the bottom of the viewport when the prerequisites above are met. Click Fusion to activate.
- From the toolbar — add via Customize Toolbar, then click Fusion.
- Keyboard shortcut — press Shift + F.
Interface
Upon activating Fusion Mode, the viewer reorganizes into the following components:
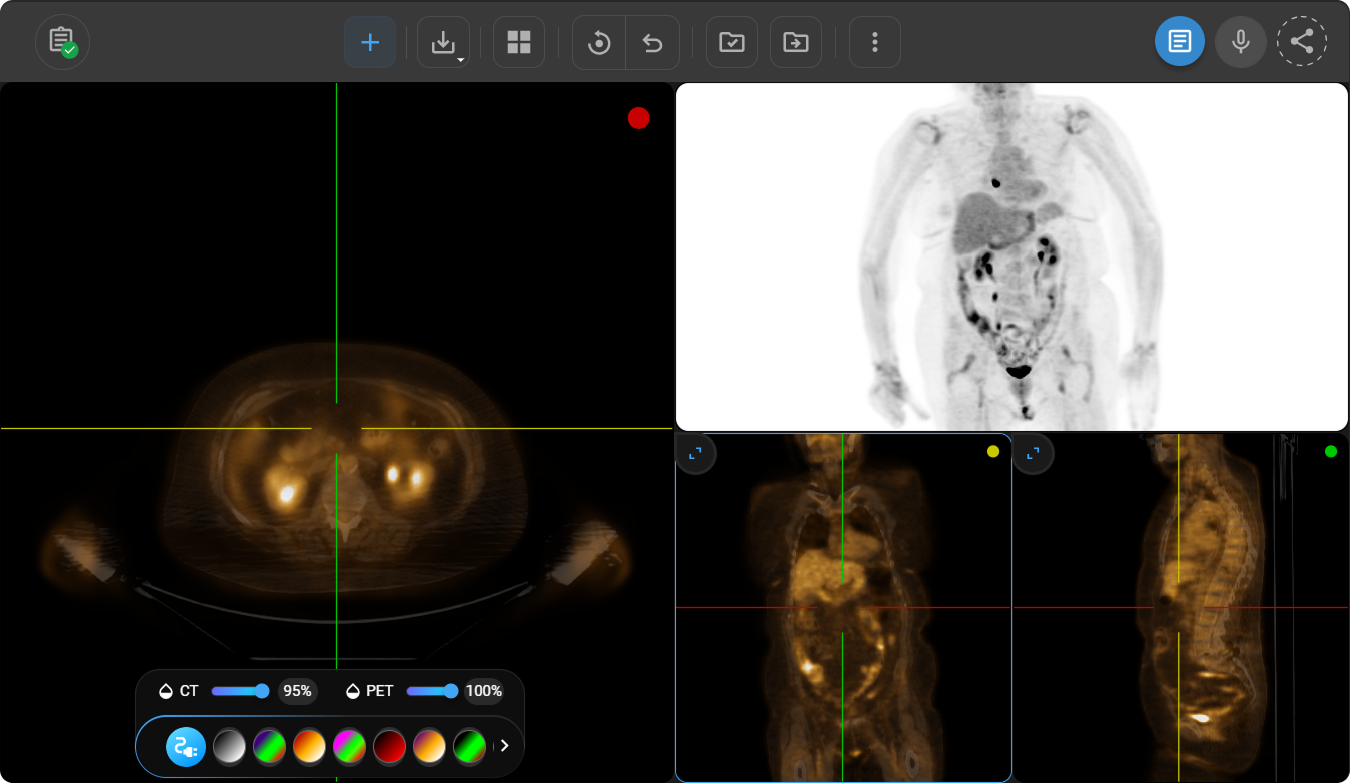
Primary Fusion Viewport
The primary fusion viewport occupies half the screen and displays the fused PET-CT image.
- Default plane: Axial view on activation.
- Plane switching: Click the expand icon at the top-left corner of any MPR viewport to maximize that view for focused review.
This viewport serves as the main workspace for detailed diagnostic assessment.
MPR Viewports
Up to four secondary MPR viewports are displayed alongside the primary fusion viewport. These may show alternative fused views (axial, coronal, or sagittal) or standalone PET or CT images, depending on the configuration.
All MPR viewports are linked and synchronized — moving the crosshair in any viewport automatically updates the corresponding anatomical location across all other views, supporting precise spatial correlation between PET uptake and CT anatomy.
MIP View
The MIP (Maximum Intensity Projection) view displays projection images derived from the volumetric PET data. It provides:
- A rapid overview for visual assessment.
- Highlighted areas of increased radiotracer uptake for quick identification of potentially suspicious regions.
- Real-time updates based on navigation and fusion settings.
Scroll the mouse wheel to rotate the MIP view and visualize it from multiple angles.
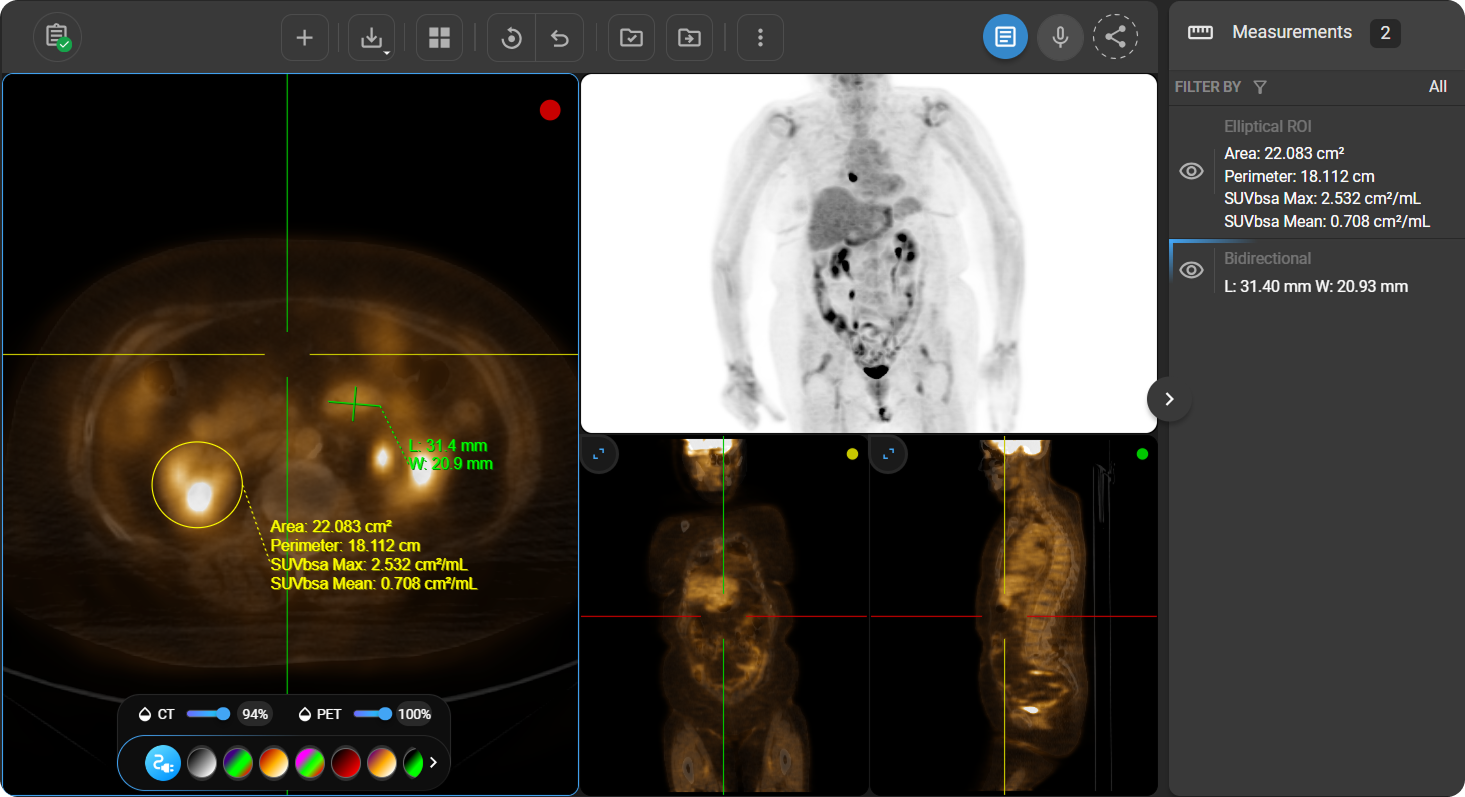
Fusion Display Controls
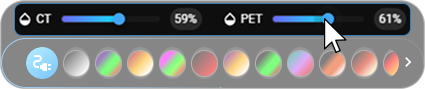
Opacity Sliders
Located at the bottom of the fusion viewport, two sliders allow fine-tuning of the fused image display:
| Slider | Function |
|---|---|
| CT Opacity | Adjusts CT image visibility. Lower values emphasize PET uptake; higher values enhance anatomical detail. |
| PET Opacity | Controls the intensity of the PET overlay. Useful for balancing tracer uptake visibility against background anatomy. |
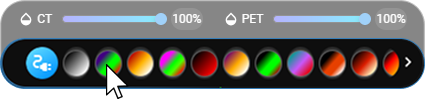
PET Color Map
Multiple PET color palettes are available to optimize contrast and highlight subtle uptake patterns. To switch color maps, click the color map selector in the Fusion Display Controls panel at the bottom of the fusion viewport. Switching color maps does not affect the underlying quantitative data.
Probe Tool — SUV Measurement
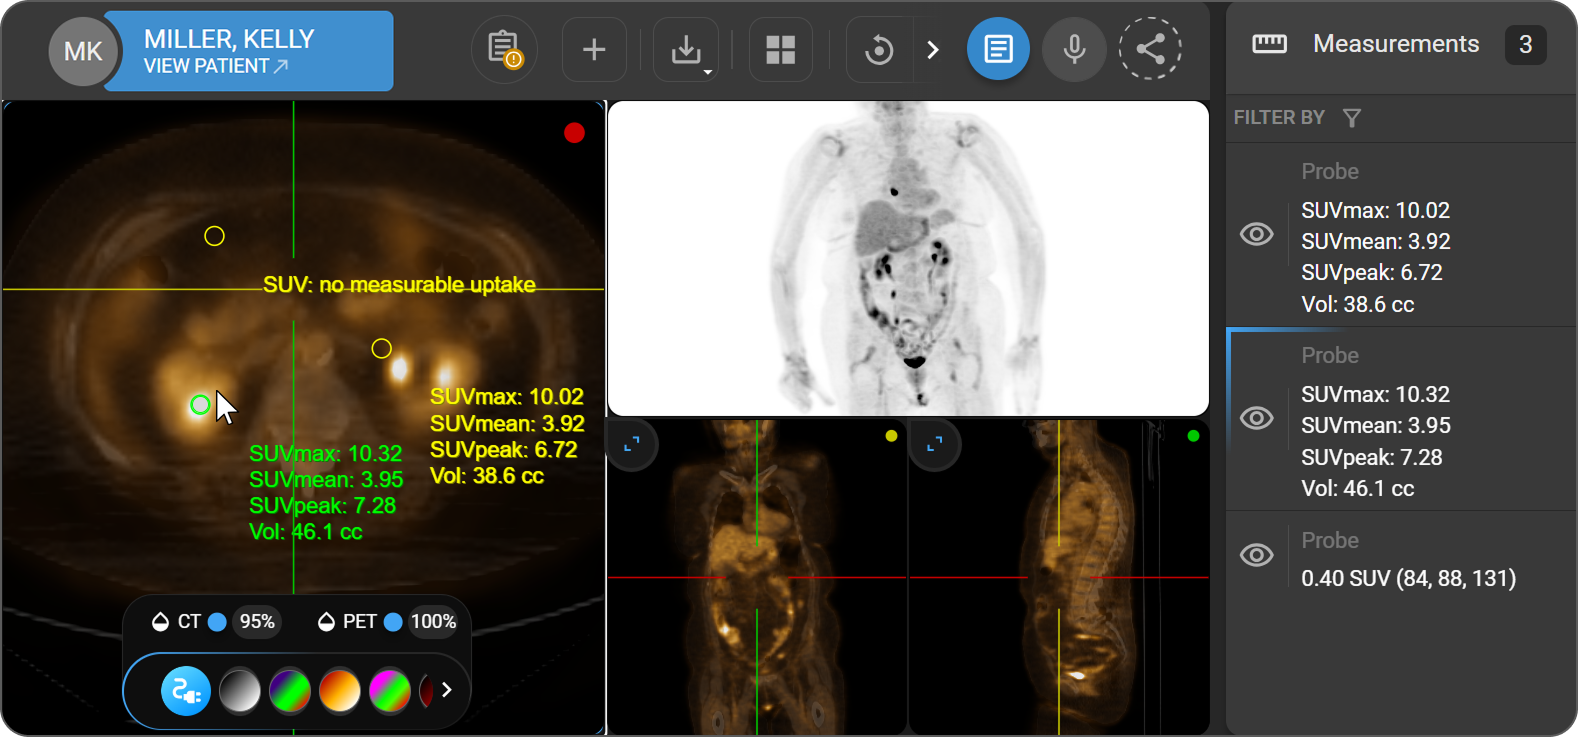
In Fusion Mode, the Probe tool calculates volumetric Standardized Uptake Value (SUV) metrics directly on the fused PET-CT image. Unlike standard probe use, OmegaAI automatically segments the uptake region — no manually drawn ROI contour is required.
The Probe tool calculates SUV metrics only on regions with detectable FDG uptake. For background or low-uptake areas, the result displays "SUV: no measurable uptake".
| Metric | Description |
|---|---|
| SUVmax | Highest SUV value recorded within the segmented region |
| SUVmean | Arithmetic mean of SUV values across all voxels in the region |
| SUVpeak | Mean SUV value within a 1 cm³ sphere centered on the SUVmax voxel |
| Vol (cc) | Total lesion volume, calculated as voxel count × voxel spacing product |
Probe markers can be repositioned by clicking and dragging — SUV values update automatically. Multiple probes can be placed simultaneously within the same study.
For general Probe tool access and usage, see Adjustment and Markup Tools.
Saving Measurements in Fusion Mode
All measurements performed in Fusion Mode are automatically saved within the active session. Measurements remain preserved after exiting Fusion Mode. When the same study is reopened in Fusion Mode, saved measurements are displayed on both the image overlay and the Measurement Panel.
To view, edit, or delete saved measurements, see Measurement Panel.