Mammography Features
Overview
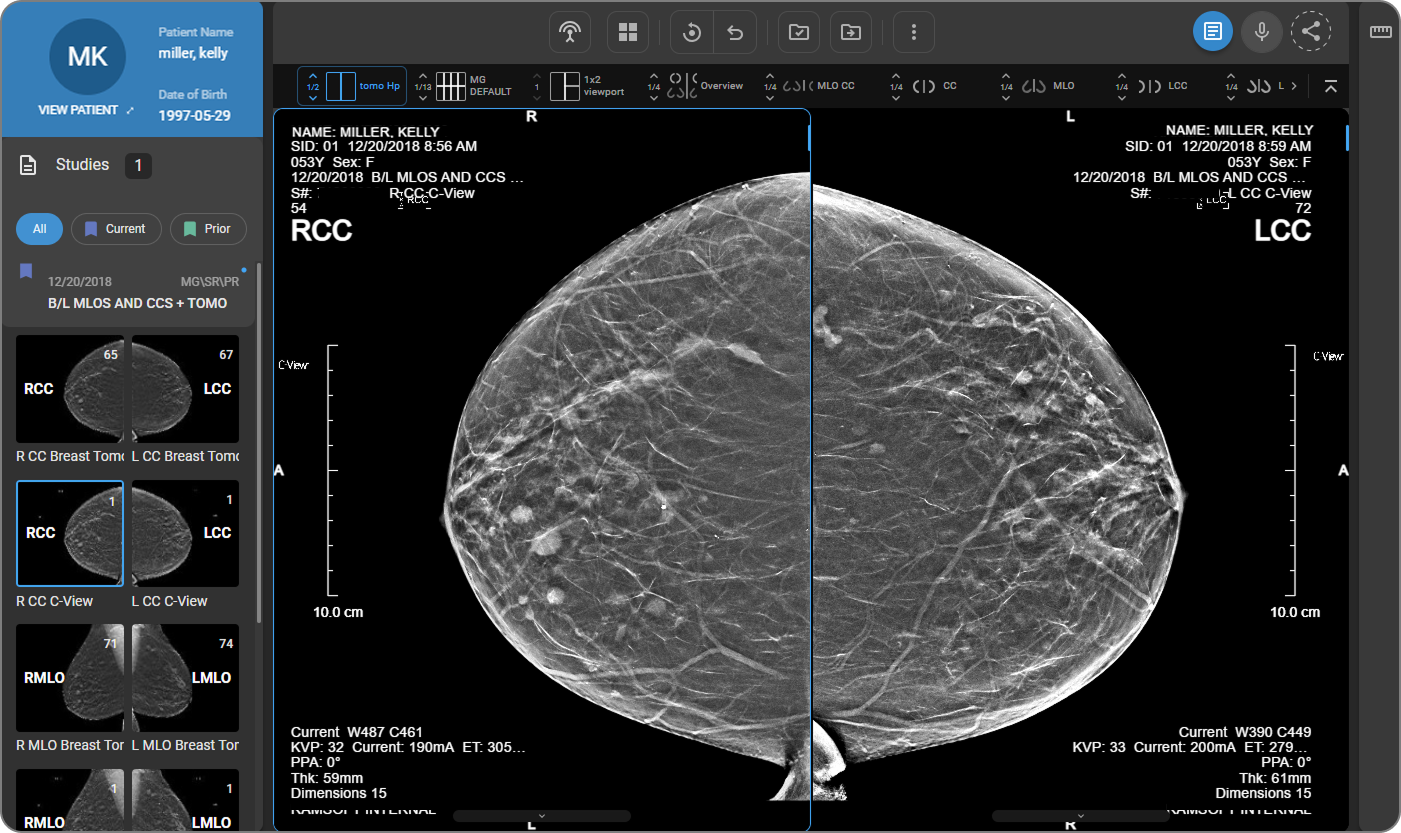
The OmegaAI Image Viewer includes a dedicated set of features for reviewing and analyzing mammography studies. These features support efficient, accurate diagnostic workflows through automatic image synchronization, laterality-aware overlays, predefined hanging protocols, and integrated Computer-Aided Detection (CAD) support.
Image Synchronization and Mirroring
The viewer displays left and right breast mammography images side by side with automatic synchronization:
-
When you scroll, pan, zoom, or adjust one image, the same action is applied to the corresponding image on the opposite side — ensuring both images always show the same anatomical area at the same time.
-
Images are automatically rotated based on laterality information from the DICOM metadata to ensure correct clinical orientation on load, without any manual adjustment required.
Overlay Annotations
Mammography-specific overlays are applied consistently across all viewports:
-
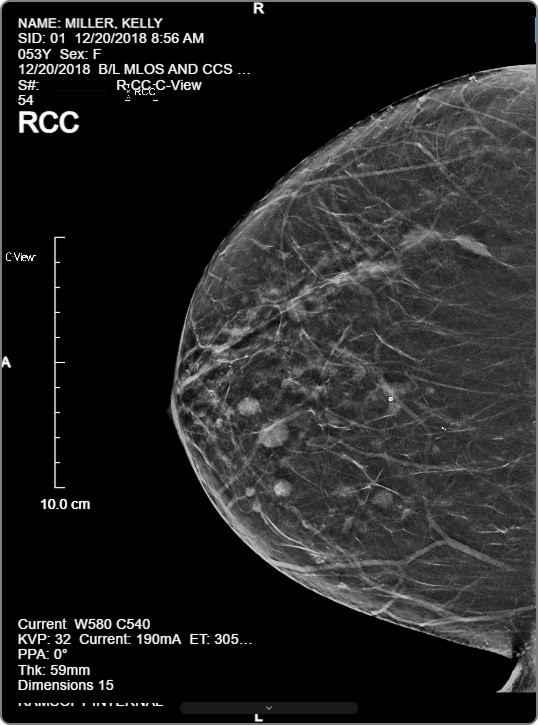
View code overlays — labels such as RCC, LCC, RMLO, and LMLO are displayed in a large font for easy identification at a glance.
-
Overlay alignment — automatically adjusts based on laterality. Overlays on right-sided images appear on the left; overlays on left-sided images appear on the right.
-
Orientation markers — displayed at the center of each viewport edge to indicate the patient's position during image acquisition.
-
Case Score — displayed as Case Score: XX (in a percentage value) when a score exists in the CAD SR data. Hidden entirely when no score is present.
-
Detections — displayed as clickable slice number hyperlinks (e.g. Detections: 36, 37, 41) in Tomo (3D/Volume) series when CAD markers are present. Hidden entirely when no CAD markers exist in the series.
-
To turn overlays on or off, click More Options (⋯) in the toolbar, expand Toggles, and click Overlay. A blue checkmark indicates the overlay is active.
To control which information appears in the overlay, see Customizing Overlay Annotations.
Mammography Hanging Protocols
The Image Viewer includes 11 predefined mammography hanging protocols, each matched to a specific combination of views available in a mammography study. These protocols automatically organize images into predefined viewing stages to streamline the reading workflow.
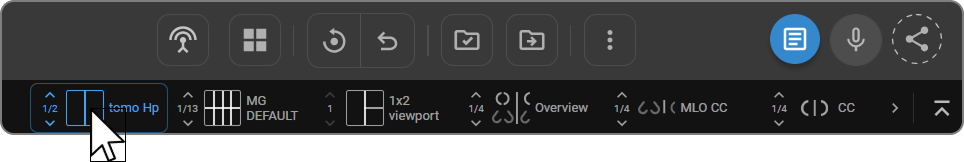
Method 1 — Quick Access Strip
The Quick Access Strip is the horizontal bar immediately below the main toolbar. It displays all available hanging protocols for the active study as tiles. Click any tile to apply it instantly.
Method 2 — Layout Selector
-
Click the Layout Selector (grid icon) in the toolbar.
-
The layout panel opens, showing a viewport grid on the left and protocol tiles on the right.
-
Click any protocol tile to apply it.
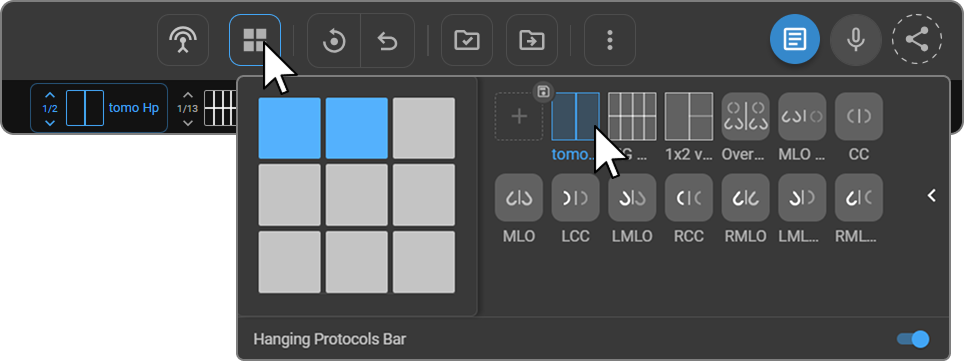
A Hanging Protocols Bar toggle is available at the bottom of the Layout Selector panel to show or hide the Quick Access Strip. To create or customize protocols, see Hanging Protocols.
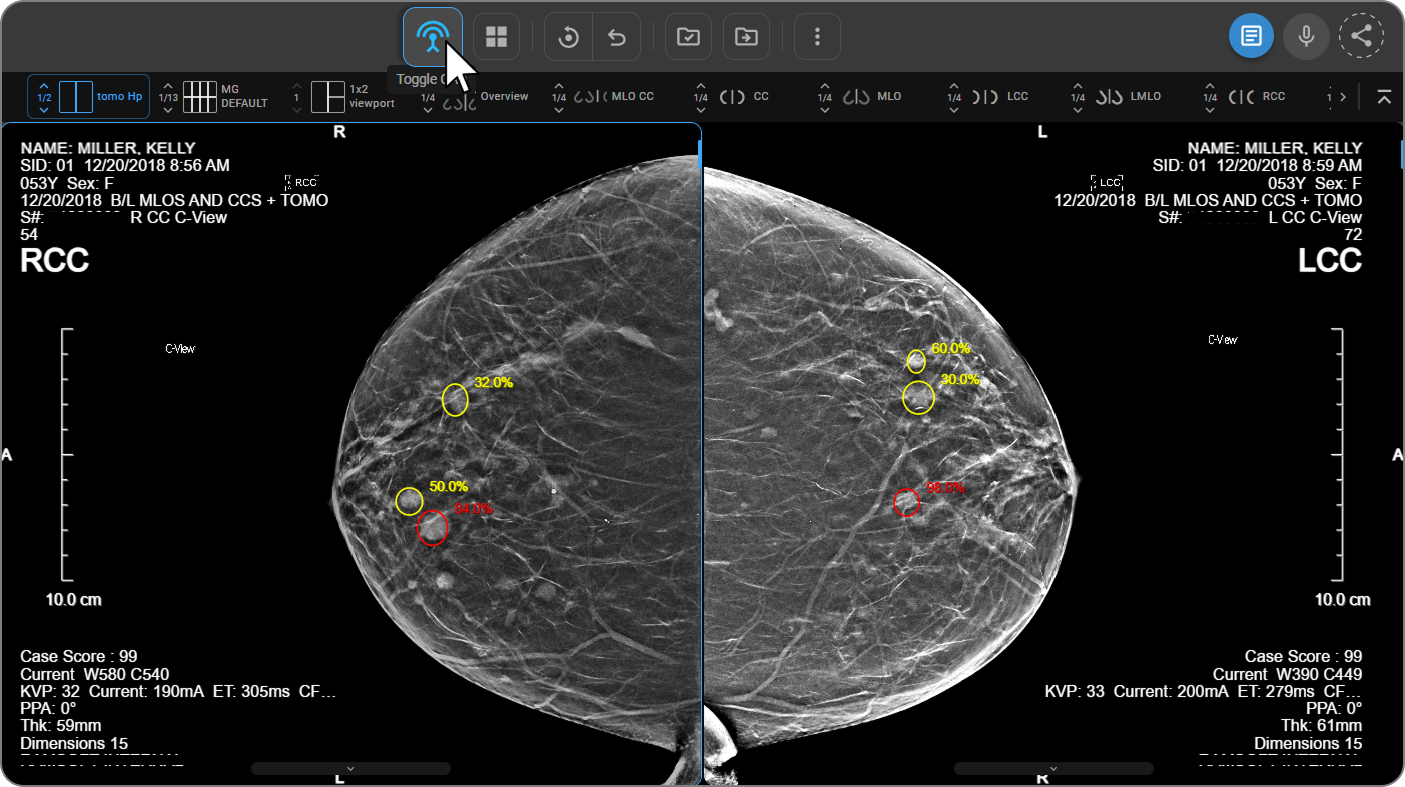
Computer-Aided Detection (CAD)
Computer-Aided Detection (CAD) is an AI-powered analysis tool that automatically identifies and flags potential findings in mammography studies — including masses, calcifications, density variations, and asymmetry markers. CAD findings are displayed as visual markers overlaid on the images, accompanied by confidence scores, helping radiologists prioritize areas of interest and supporting more consistent diagnostic review.
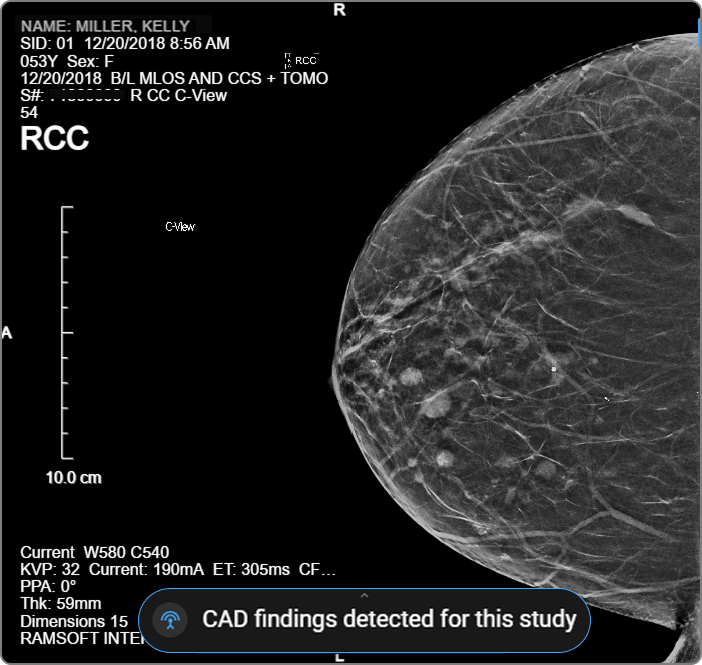
Notification
When a mammography study containing CAD findings is opened, the system automatically displays a "CAD findings detected for this study" notification at the bottom of the viewport.
Toggle CAD
The Toggle CAD button appears in the toolbar when a mammography study containing CAD SR objects is loaded. It is not visible for non-mammography studies or studies without CAD data.
By default, the toggle is off and all CAD markers are hidden. Clicking the button shows or hides all CAD markers across every viewport simultaneously.
| State | Icon | Markers |
|---|---|---|
| OFF (default) | Normal | Hidden |
| ON | Blue highlight | Visible |
CAD visibility can also be controlled at the protocol level within Hanging Protocols.
CAD Annotations
Once CAD is toggled on, the viewport overlay displays the following annotations at the bottom of each viewport.
Case Score
The overall iCAD case score is displayed as Case Score: XX (e.g. Case Score: 99). Shown only when a score exists in the CAD SR data. Hidden entirely when no score is present.
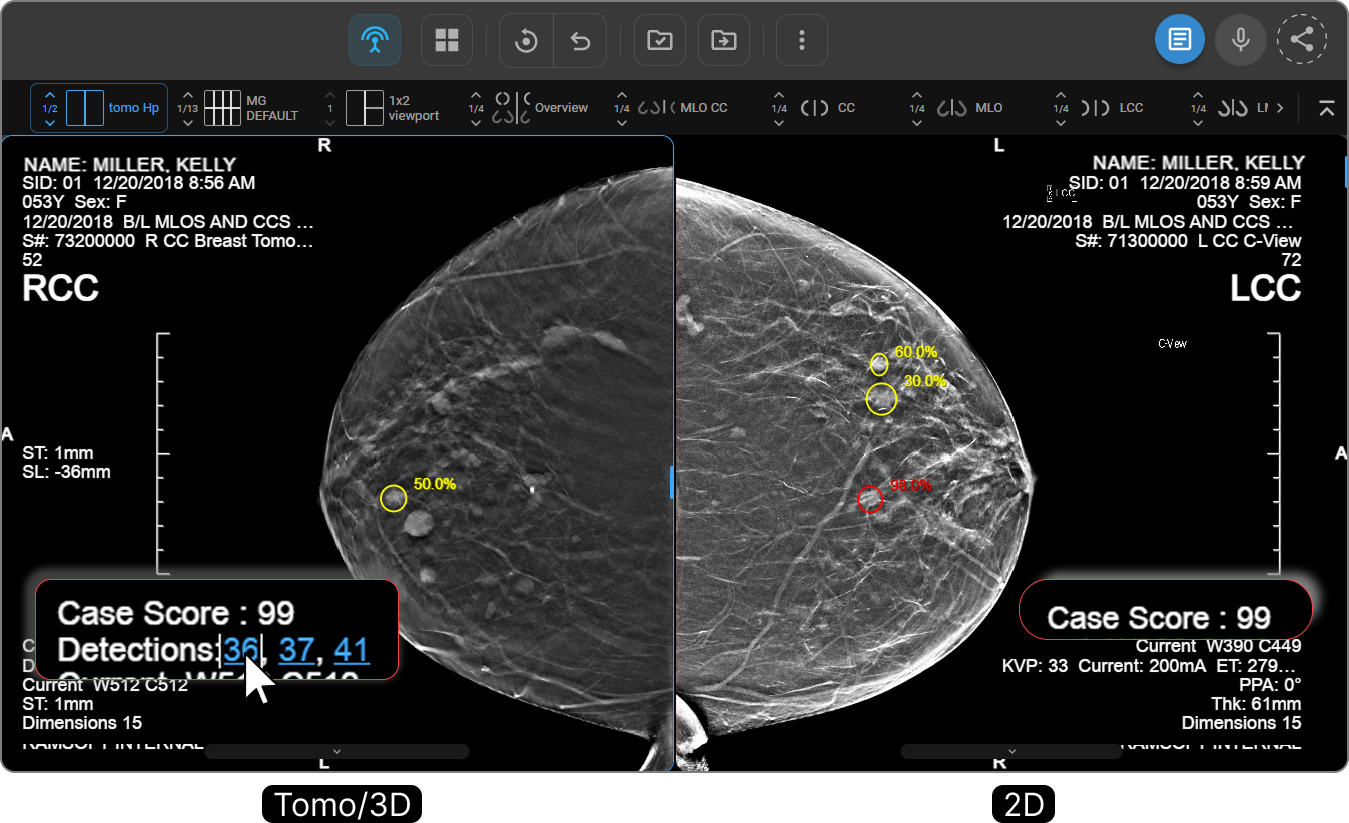
Detections
For Tomo (3D/Volume) series, clickable slice number hyperlinks are shown as Detections: XX, XX, XX (e.g. Detections: 36, 37, 41). Clicking a number navigates the viewport to that frame with the corresponding CAD marker visible.
Detection numbers follow these rules:
-
Displayed in ascending order.
-
If multiple detections exist on the same frame, that frame number appears only once.
-
Hidden entirely when no CAD markers exist on the series.
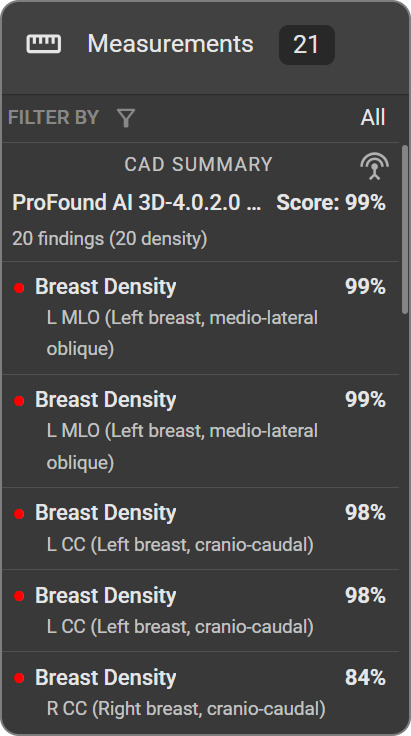
CAD Summary Panel
When CAD objects are detected, the Measurement Panel on the right side of the viewer displays a CAD Summary listing all findings for the study. The summary shows:
|  |
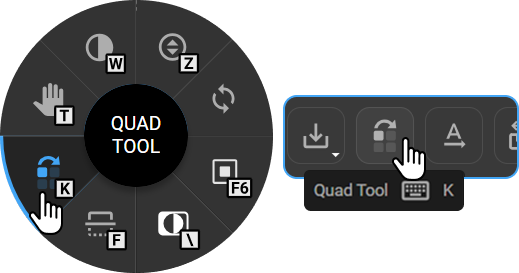
Quad Tool
The Quad Tool divides a mammography image into four quadrants and automatically zooms into each one sequentially, ensuring a thorough and systematic review of all breast regions.
To activate the Quad Tool:
-
Open the mammography image in the Image Viewer.
-
Select the Quad Tool from any of the following:
-
Image Control Wheel — right-click on the viewport (available if added via Customize Wheel).
-
Toolbar — click the Quad Tool icon (available if added via Customize Toolbar).
-
Keyboard — press K (default shortcut).
-
- Click once on the image to activate the tool. The viewer automatically zooms into the first quadrant based on the breast side and navigation direction.
Navigating quadrants:
Once activated, the mouse cursor changes to indicate the direction of quadrant flow.
| Right breast — starts at the Top Right quadrant, cycles clockwise. Each left-click advances to the next quadrant. | 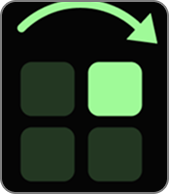 |
| Left breast — starts at the Top Left quadrant, cycles anticlockwise. Each left-click advances to the next quadrant. | 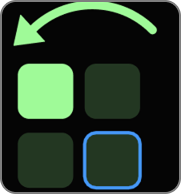 |
Continue clicking to cycle through all four quadrants in order. Press Esc to return to the normal full-image view.